

Thursday stocks moved higher at the open but an earnings miss by UPS and poor forward guidance spooked investors who sent transport shares lower including rival, FedEx. That combined with a further drop in many tech stocks including more downside from Alphabet, saw stocks begin a retreat during the lunch hour from fresh all-time highs. By early afternoon the markets were at their lowest levels. A small rally managed to contain the selling but volume was higher and sellers were definitely taking profits. In the past this has happened near the end of earnings week, as a lot of investors decide to take profits on stocks that have risen thanks to earnings. The question is whether this is a one day event or the start of more weakness.
S&P Index Close
The S&P index ended the day down 2.41 to close at 2475.42 but made a new intraday all-time high of 2484.04.
Dow Jones Index Close
The Dow Jones ended up 85.54 at 21,796.55 and 200 points shy of 22,000. During the day it rose to a new intraday high if 21,798.47 and closed below it by just a couple of points.
NASDAQ Index Close
The NASDAQ closed down 40.56 points to 6,382.19 after setting a new intraday high of 6460.84.
Stock Market Outlook
Chart Comments At The Close:
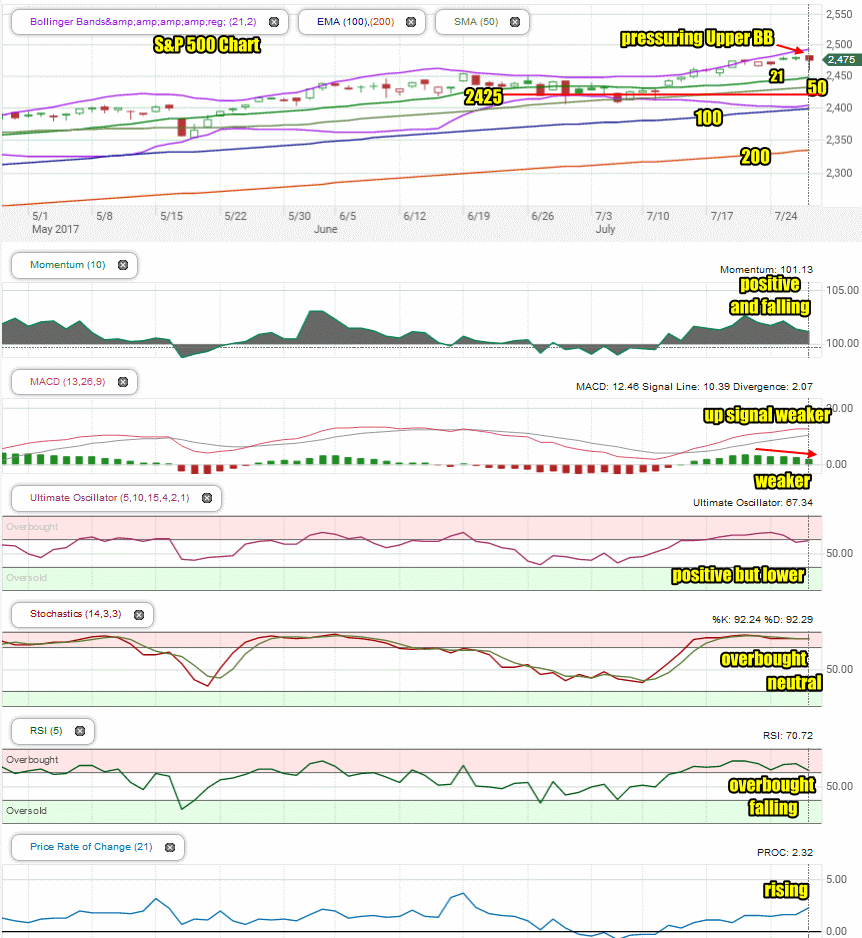
The S&P has been grinding higher but the daily gains this week have been small. That gave investors another reason to take profits. The selling intensified over the lunch hour but didn’t reach the 21 day moving average.
The major moving averages are continuing to climb and and the Bollinger Bands are still pointing to the market climbing higher however the closing candlestick on Thursday is bearish for Friday. The 2425 level is still the main support for the present rally.
SPX Outlook for July 27 2017
Stock Market Outlook: Technical Indicators:
Momentum: For momentum I use a 10 period when studying market direction. Momentum remains positive but has been falling.
MACD Histogram: For MACD Histogram, I am using the Fast Points set at 13, Slow Points at 26 and Smoothing at 9. MACD (Moving Averages Convergence / Divergence) issued a buy signal on July 14. The buy signal is weaker but as you can see in the MACD histogram, weakness is creeping into the rally as it is moving more sideways than higher.
Ultimate Oscillator: The Ultimate Oscillator settings are: Period 1 is 5, Period 2 is 10, Period 3 is 15, Factor 1 is 4, Factor 2 is 2 and Factor 3 is 1. These are not the default settings but are the settings I use with the S&P 500 chart set for 1 to 3 months. The Ultimate Oscillator is positive but overbought and dipping lower.
Slow Stochastic: For the Slow Stochastic I use the K period of 14 and D period of 3. The Slow Stochastic tries to predict the market direction further out than just one day. The Slow Stochastic is overbought but signaling neutral for Friday..
Relative Strength Index: The relative strength index is set for a period of 5 which gives it 5 days of market movement to monitor. It often is the first indicator to show an overbought or oversold signal. The RSI signal is falling from overbought signals.
Rate of Change: Rate Of Change is set for a 21 period. This indicator looks back 21 days and compares price action from the past to the present. The rate of change signal is positiveand was rising.
Support Levels To Be Aware Of:
The market has developed good support at 2425 and light support at 2400, 2380, 2350 and 2300.
Stock Market Outlook for Tomorrow – Friday Jul 28 2017
For Friday the technical indicators are still positive but all but one are showing signs of pulling back.
MACD is losing strength to the up signal which is particularly concerning. Overall Friday looks like stocks will move lower into the close.
A negative close on Friday should be expected as the bias is shifting to lower thanks to the sideways action of the past week in the S&P and the selling on Thursday.
Stay FullyInformed With Email Updates
Market Direction Internal Links
Profiting From Understanding Market Direction (Articles Index)
Understanding Short-Term Signals
Market Direction Portfolio Trades (Members)
Market Direction External Links
IWM ETF Russell 2000 Fund Info
Market Direction SPY ETF 500 Fund Info