
 The weakness and dips today in the indexes was anticipated. Two days of solid gains and the Dow Jones breaking through 20,000, set the market up for this type of day. The close though saw only very slight losses on the S&P and NASDAQ as they recovered easily from the profit-taking that took place today. The Dow Jones pushed to another new intraday high at 20,125.58 before closing at 20,100.91.
S&P Index Close
The S&P index ended the day down just 1.69 to 2269.68. During the day the S&P broke to 2300 but sellers took command and kept the index in check from moving higher.
Dow Jones Index Close
The Dow Jones ended up 32.40 to 20,100.91.
NASDAQ Index Close
The NASDAQ closed down just 1.16 to 5655.18. During the day it set another new intraday high reaching 5,669.61.
Stock Market Outlook

Stock Market Outlook review of Jan 26 2017
Chart Comments At The Close:
The Bollinger Bands Squeeze is ending with the index pushing higher, as you can see in the chart. All the moving averages are rising and the 50 day is now moving inside the Lower Bollinger Band which is also bullish. The closing candlestick on Thursday is neutral on the outlook for Friday.
Support Levels To Be Aware Of:
The market has been trying to build support at the 2250 level. There is light support at 2195 but better support is at 2180 and then 2150.
Stock Market Outlook: Technical Indicators:
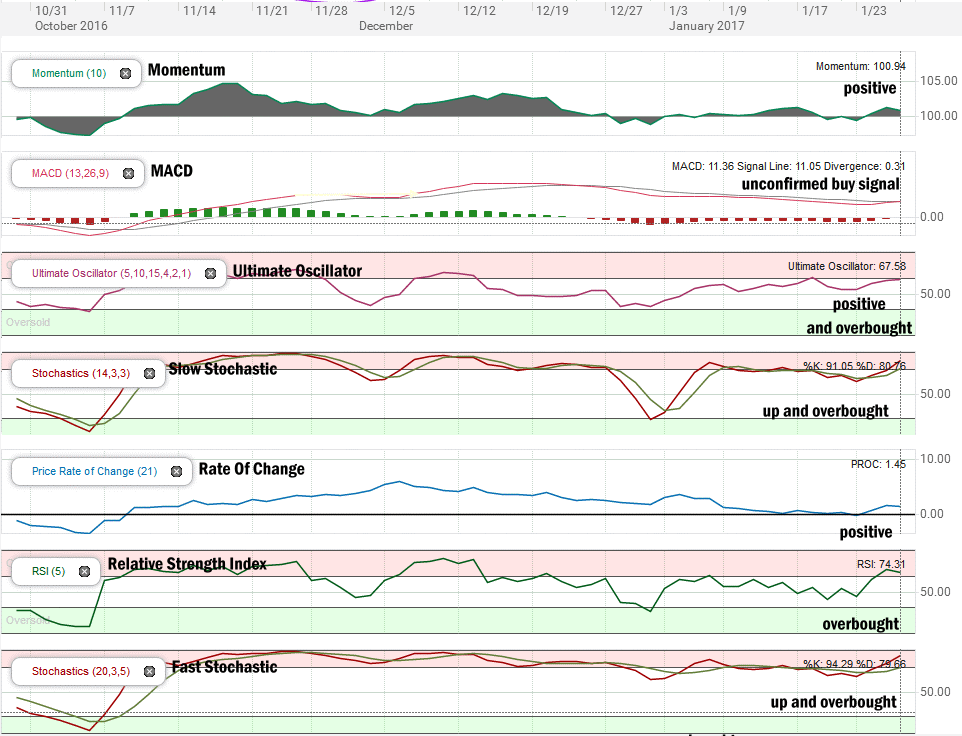
Stock Market Outlook technical review of Jan 26 2017
Momentum: For momentum I use a 10 period when studying market direction. Momentum is still positive but moving sideways.
MACD Histogram: For MACD Histogram, I am using the Fast Points set at 13, Slow Points at 26 and Smoothing at 9. MACD (Moving Averages Convergence / Divergence) issued a sell signal Dec 23 2016. An unconfirmed buy signal was generated today.
Ultimate Oscillator: The Ultimate Oscillator settings are: Period 1 is 5, Period 2 is 10, Period 3 is 15, Factor 1 is 4, Factor 2 is 2 and Factor 3 is 1. These are not the default settings but are the settings I use with the S&P 500 chart set for 1 to 3 months. The Ultimate Oscillator is positive and signaling that the market is overbought.
Slow Stochastic: For the Slow Stochastic I use the K period of 14 and D period of 3. The Slow Stochastic tries to predict the market direction further out than just one day. The Slow Stochastic has an up signal in place and is overbought.
Rate of Change: Rate Of Change is set for a 21 period. This indicator looks back 21 days and compares price action from the past to the present. The rate of change signal is positive and moving sideways.
Relative Strength Index: The relative strength index is set for a period of 5 which gives it 5 days of market movement to monitor. It often is the first indicator to show an overbought or oversold signal. It is overbought.
Fast Stochastic: For the Fast Stochastic I use the K period of 20 and D period of 5. These are not default settings, but settings I use for the 1 to 3 month S&P 500 chart when I have it set for daily views. The Fast Stochastic has an up signal in place and is overbought.
Stock Market Outlook for Tomorrow – Friday Jan 27 2017
There are no negative technical indicators after the close on Thursday Jan 26. MACD has an unconfirmed buy signal in place but even it too is no longer flashing a negative signal.
Friday could see further sideways action and there is always the chance of a further dip from sellers, but the outlook for Friday is now a “slow climb” as the markets should see the S&P punch through 2300 either Friday or Monday but a large rally is not expected. From here the market should slowly grind higher.
Technically the stock markets are in good shape for the start, shortly, of the first week of February.
Stay FullyInformed With Email Updates
Market Direction Internal Links
Profiting From Understanding Market Direction (Articles Index)
Understanding Short-Term Signals
Market Direction Portfolio Trades (Members)
Market Direction External Links
IWM ETF Russell 2000 Fund Info
Market Direction SPY ETF 500 Fund Info