FullyInformed.com
Generic filters
Exact matches only
Search in title
Search in content
Search in excerpt

Stock Market Outlook for Fri Sep 27 2024 – Choppy – Dips Likely But Higher

Sep 26, 2024 | Stock Market Outlook

Stock Market Outlook Choppy Dips Higher

Prior Trading Day Summary:

Thursday started off strong with the SPX hitting 5767, a new high but then investors once again ran into sellers. This time volumes rose higher with the SPX reaching 4.5 billion by the close and the NASDAQ seeing 5.8 billion shares traded. Both indexes closed higher but the initial height of the SPX was not recovered. This impact some of the technical indicators that are advising caution ahead of the PCE index numbers due out on Friday.

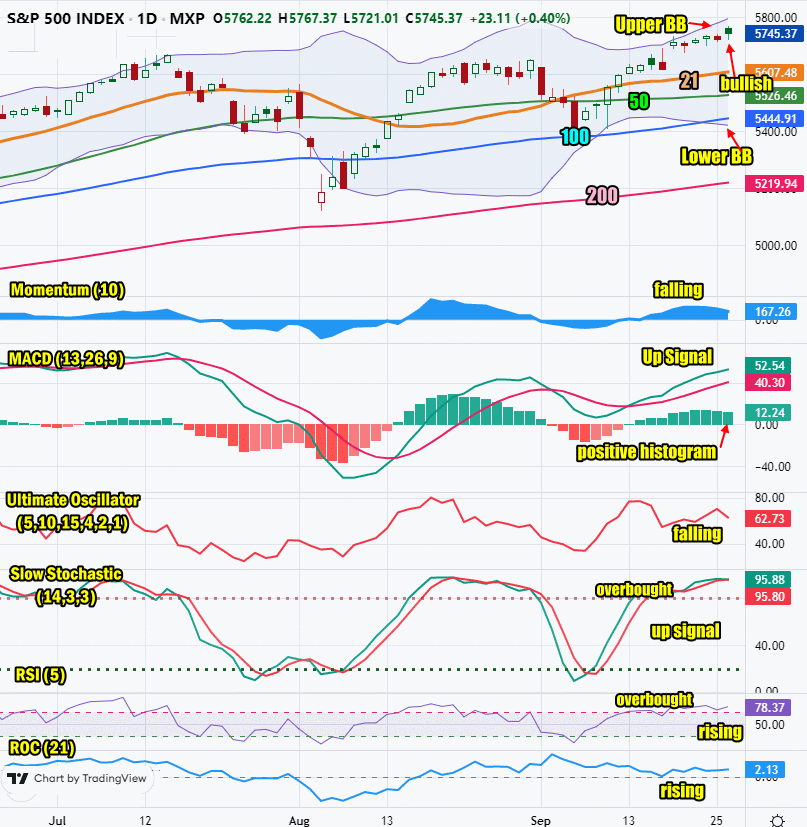
The SPX closed up 23 points to 5745, another new closing higher.

The NASDAQ rose 108 points matching Tuesday’s rally and extending the NASDAQ rally into a fourth day. It closed at 18,190.

The NASDAQ traded 5.0 billion shares a decrease of 500 million shares, to close up 7 points to 18,082.

After hours Costco reported earnings of $5.15 a share on revenue of $79.70 billion. This was well above last year’s $4.86 a share on revenue of $78.90 billion. The stock was lower after hours but I think that will reverse once the stock begins trading on Friday.

Let’s review the closing technical indicators from Thu Sep 26 2024 to see what to expect on Fri Sep 27 2024.


Stock Market Outlook: SPX Closing Chart For Thu Sep 26 2024

The index closed above the 21 day moving average and at the Upper Bollinger Band which is bullish.

The closing candlestick has two shadows (head and tail). The head is shorter which indicates buyers were still buying into the close. The tail shadow indicates sellers which often signals some weakness building.

The 21 day moving average is higher at 5607. This is bullish.

The 50 day moving average is higher at 5526. This is bullish.

The 100 day moving average is rising and closed at 5444 which is bullish.

The 200 day moving average is in an uptrend and closed at 5219 which is bullish.

The Lower Bollinger Band is below the 100 day moving average which is bullish.

The Upper Bollinger Band is rising which is bullish.

The S&P chart is more bullish than bearish for Friday with just the closing candlestick warning.

SPX Stock Market Outlook review of Thu Sep 26 2024


Stock Market Outlook: Technical Indicators Review

Momentum: Momentum is falling and positive for a second day.

  • Settings: For momentum I use a 10 period when studying market direction.
MACD Histogram: MACD (Moving Averages Convergence / Divergence) issued an up signal on Fri Sep 13 2024. The up signal was weaker again on Thursday.

  • Settings: For MACD Histogram, I am using the Fast Points set at 13, Slow Points at 26 and Smoothing at 9. 
Ultimate Oscillator: The Ultimate Oscillator is falling and positive.

  • Settings: The Ultimate Oscillator settings are: Period 1 is 5, Period 2 is 10, Period 3 is 15, Factor 1 is 4, Factor 2 is 2 and Factor 3 is 1. These are not the default settings but are the settings I use with the S&P 500 chart set for 1 to 3 months.
Slow Stochastic: The Slow Stochastic has a very weak up signal and is at overbought levels. A down signal may occur tomorrow.

  • Settings: For the Slow Stochastic I use the K period of 14 and D period of 3. The Slow Stochastic tries to predict the market direction further out than just one day.
Relative Strength Index: The RSI signal is rising and positive. It is at overbought levels.

  • Settings: The relative strength index is set for a period of 5 which gives it 5 days of market movement to monitor.  It is often the first indicator to show an overbought or oversold signal.
Rate of Change: The rate of change signal is rising which advises Friday will end higher.

  • Settings: Rate Of Change is set for a 21 period. This indicator looks back 21 days and compares price action from the past to the present. With the Rate Of Change, prices are rising when signals are positive. Conversely, prices are falling when signals are negative. As an advance rises, the Rate Of Change signal should also rise higher, otherwise the rally is suspect. A decline should see the Rate Of Change fall into negative signals. The more negative the signals the stronger the decline.

Stock Market Outlook: Support and Resistance Levels

5750 is resistance
5740 is resistance
5715 is resistance
5700 is resistance
5650 is resistance
5625 is resistance
5615 is resistance
5600 is resistance
5575 is resistance
5550 is light support
5525 is support
5500 is support
5470 is support
5450 is support
5425 is support
5400 is support


Stock Market Outlook for Fri Sep 27 2024 

Some of the opening bounce on Thursday came about from the Chinese stimulus measures announced which rallied markets. Our markets responded in kind at the open, despite Weekly Initial Unemployment Insurance Claims coming in lower than expected at 218000.

The technical indicators are continuing to show weakness growing to the rally which is also reflected in the closing candlestick on the SPX today. Momentum is continuing to sag and the MACD and Slow Stochastic indicators are both losing strength to the up signal. The MACD is the more important signal to watch and it is declining in strength which is readily seen in the declining histogram.

On Friday we get the latest Personal Consumption Expenditures (PCE) numbers which are followed closely by the Fed. Personal income is expect to have risen but personal spending is estimated to have decline. The index overall is expected to be slightly lower while the core PCE is estimated to have risen slightly. If all of this holds true markets should move higher on Friday. Any large miss could see stocks open lower.

Costco reported earnings that were slightly above estimates but showed just 0.96% revenue growth year-over-year. The stock moved lower after hours on Thursday which might weigh on the open.

For Friday then the outlook is once again for a choppy day with dips but a higher close.


Potential Economic and Political Market Moving Events

Monday:

9:45 S&P flash services PMI came in as expected at 55.4

9:45 S&P flash manufacturing PMI was lower than expected at 47

Tuesday:

9:00 Case-Shiller home price index came in lower than expected at 5.9%

10:00 Consumer confidence was a lot lower than expected coming in at 98.7

Wednesday:

10:00 New homes sales rose to 716,000 which was above estimated of 700,000

Thursday:

8:30 Weekly Initial Unemployment Insurance Claims were lower than expected at 118,000

8:30 Durable goods orders were flat at 0.0%

8:30 GDP (second revision) came in as expected at 3.0% for the quarter

10:00 Pending home sales were lower than expected at 0.6%

7 Fed officials are speaking at various times and locations throughout the day continuing to push the declining interest rate narrative. This should be bullish for stocks.

Friday:

8:30 Personal income is expected to have risen to 0.4%

8:30 Personal spending is estimated to have fallen to 0.3%

8:30 PCE Index is expected lower at 0.1%

8:30 PCE (year-over-year) is expected to have declined to 2.3% from 2.5%

8:30 Core PCE index is estimated unchanged at 0.2%

8:30 Core PCE (year-over-year) is estimated to have risen to 2.7% from 2.6%

8:30 Advanced wholesale inventories is estimated to be unchanged at 0.2%

8:30 Advance retail inventories is estimated to be unchanged at 0.8%

10:00 Sep Consumer Sentiment is estimated at 69.3, up slightly from 69.0 prior.


Recent Outlooks

Morning Investing Strategy Notes for Wed Jun 18 2025

For FullyInformed Members the morning Investing Strategy Notes for Wed Jun 18 2025 review the outlook after Tuesday’s drop. Stocks discussed today include Microsoft Stock (MSFT),  SPY ETF and more. The morning Investing Strategy Notes are for FullyInformed Members.   …

Stock Market Outlook For Wed Jun 18 2025 – Choppy and Lower – Fed Rate Decision Due

Prior Trading Day Summary: On Tue Jun 17 2025 stocks moved lower as the fighting between Israel and Iran escalated. With concerns of further US involvement, stocks ended the day lower ahead of Wednesday’s Fed rate decision announcement. The S&P …

Morning Investing Strategy Notes for Tue Jun 17 2025

For FullyInformed Members the morning Investing Strategy Notes for Tue Jun 17 2025 review the outlook after Monday’s bounce back. Stocks discussed today include Lennar Corp Stock (LEN), SPY ETF, Microsoft Stock (MSFT) and more. The morning Investing Strategy Notes …

Stock Market Outlook For Tue Jun 17 2025 – Morning Weakness Possible But Higher Close

Prior Trading Day Summary: On Mon Jun 16 2025 stocks jumped at the open, reaching above 6000. From there stocks climbed until around 10:30 when the day’s high was made. From there the remainder of the day saw a gradual …

Morning Investing Strategy Notes for Mon Jun 16 2025

For FullyInformed Members the morning Investing Strategy Notes for Mon Jun 16 2025 review the outlook after Friday’s sell-off. Stocks discussed today include Lennar Corp Stock (LEN), SPY ETF and more. The morning Investing Strategy Notes are for FullyInformed Members …

Stock Market Outlook For Mon Jun 16 2025 -Cautious and Lower

Prior Trading Day Summary: On Fri Jun 13 2025 stocks dipped as Israel and Iran traded attacks which unnerved investors and pushed the price of oil higher. The SPX closed down 68 points to close at 5976. The index lost …

Morning Investing Strategy Notes for Fri Jun 13 2025

For FullyInformed Members the morning Investing Strategy Notes for Fri Jun 13 2025 review the outlook after Thursday’s slightly higher close. Stocks discussed today include Oracle Stock (ORCL), Adobe Stock (ADBE) and more. The morning Investing Strategy Notes are for …

Stock Market Outlook For Fri Jun 13 2025 – Still Higher

Prior Trading Day Summary: On Thu Jun 12 2025 stocks dipped to start the day as the Weekly Initial Unemployment Insurance Claims came in slightly higher than estimated at 248,000. This seemed to spook investors who opened the day with …

Morning Investing Strategy Notes for Thu Jun 12 2025

For FullyInformed Members the morning Investing Strategy Notes for Thu Jun 12 2025 review the outlook after Wednesday’s small loss. Stocks discussed today include RH Stock (RH), Adobe Stock (ADBE) and more. The morning Investing Strategy Notes are for FullyInformed …

Stock Market Outlook For Thu Jun 12 2025 – Dips Likely – Possible Lower Close

Prior Trading Day Summary: On Wed Jun 11 2025 the latest inflation reading showed only a small rise of 0.1% which helped stocks start the day higher. But as the day wore on, more details emerged about the ongoing China-USA …

Morning Investing Strategy Notes for Wed Jun 11 2025

For FullyInformed Members the morning Investing Strategy Notes for Wed Jun 11 2025 review the outlook Wednesday after Tuesday’s higher close. Stocks discussed today include Oracle Stock (ORCL), VISA Stock (V) and more. The morning Investing Strategy Notes are for …

Stock Market Outlook For Wed Jun 11 2025 – A Little Weakness But Still Higher

Prior Trading Day Summary: On Tue Jun 10 2025 the indexes continued to climb but in a choppy day. By the close the SPX was up 33 points to 6038. Volume rose by 200 million shares to 4.9 billion and …

Morning Investing Strategy Notes for Tue Jun 10 2025

For FullyInformed Members the morning Investing Strategy Notes for Tue Jun 10 2025 review the outlook Tuesday after Monday’s relatively flat close. Stocks discussed today include Robin Hood Stock (HOOD), Apple Stock (AAPL), Boeing Stock (BA), Chewy Stock (CHWY) and …

Stock Market Outlook For Tue Jun 10 2025 – Choppy – Dips Likely But Higher

Prior Trading Day Summary: On Mon Jun 9 2025 indexes closed slightly positive in what was a choppy session. For much of the day the SPX was trading above 6010 but the final hour saw stocks fall back. The SPX …

Subscribe For The Latest News