
Thursday saw selling continue but there was a distinct sideways pattern throughout the day. A rally in the final hour found sellers waiting into the close who pushed the index lower to end the day down almost 32 points at 3758.
The NASDAQ lost 153 points to close at 11066.
To Thursday’s close the S&P has now lost 115 points while the NASDAQ has given up 381 points.
Another interesting aspect of Thursday was volume, which rose to the highest level of the week for both the S&P and NASDAQ. At the same time, the number of new 52 week lows surged with the S&P showing 726 new lows and the NASDAQ 944 new lows. To find numbers this bad we have to go back to the second week of June. On June 16 the S&P had 1092 new 52 week lows and closed at 3666. The NASDAQ had 1165 new lows and closed at 10,646.
The markets are making their way lower but after June 16, the index bounced and there are many similarities developing this past week as we saw the second week of June before markets bounced and started their summer rally. With one more week in September but then October lying ahead, the best we can look for are signs of a potential short-term bounce, not a rally.
Let ‘s review Thursday’s close to see what to expect for Friday.
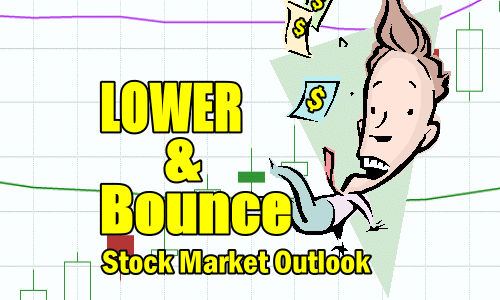
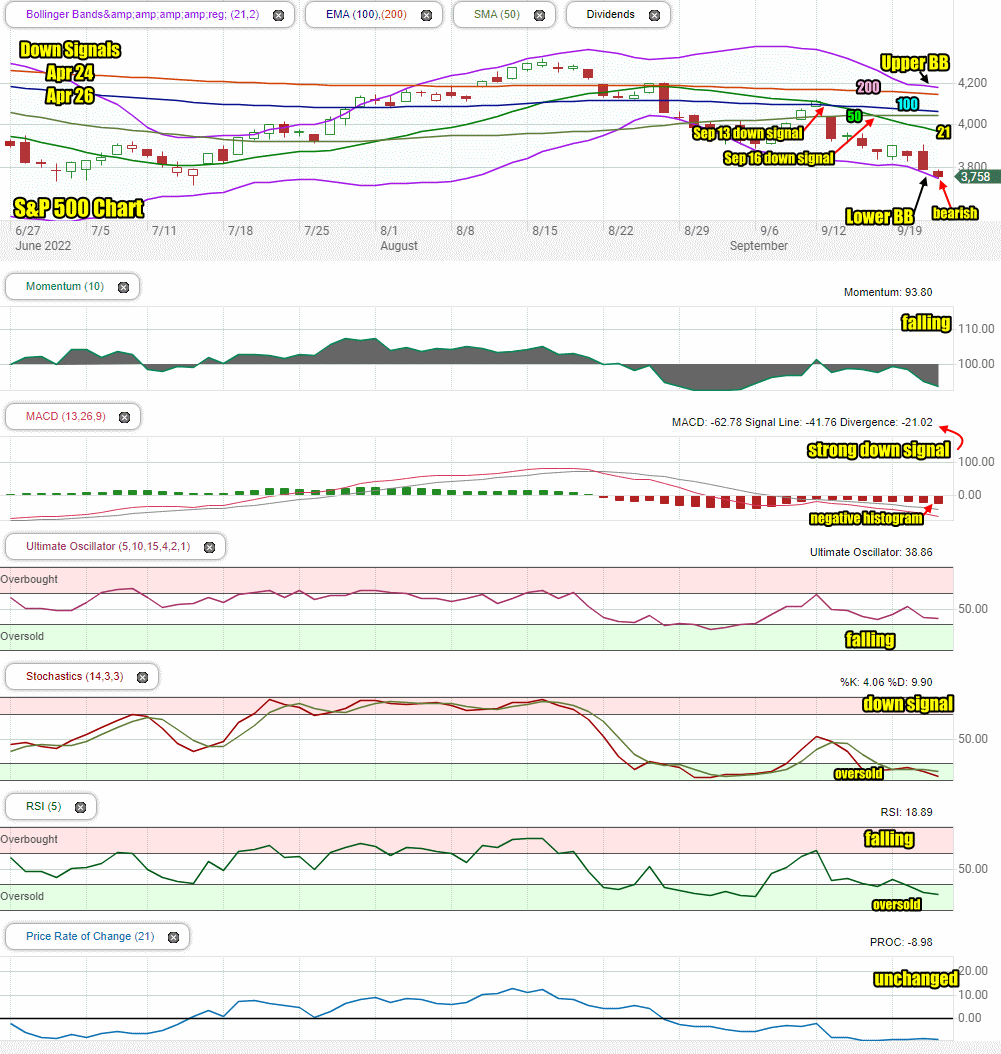
Stock Market Outlook Chart Comments At The Close on Thu Sep 22 2022
At the close of trading the S&P closing candlestick is once again bearish for Friday but also is signaling the index is overbought and a bounce could take shape.
The 21 day moving average continued its descent.
The Bollinger Bands Squeeze is probably not going to occur as the Upper Bollinger Band is starting to turn higher while the Lower Bollinger Band is falling. This signals lower prices ahead for the index.
All the moving averages are turning lower which is bearish.
The 200 day continues to decline. The 100 day moving average is falling and may cross below the 50 day on Friday or Monday if there is no bounce.
There are now 4 down signals in place since April and no up signals.
The chart is 95% bearish for Friday with just the closing candlestick offering a little hope a bounce could be take shape.
Stock Market Outlook review of Thu Sep 22 2022
Stock Market Outlook: Technical Indicators Review:
Momentum: Momentum is falling sharply and negative. It too is reaching readings where we would expect a bounce to take shape.
- Settings: For momentum I use a 10 period when studying market direction.
MACD Histogram: MACD (Moving Averages Convergence / Divergence) issued a down signal on Monday Aug 22. On Thursday the down signal gained strength. The histogram also gained strength. Both signals are gaining strength to the downside.
- Settings: For MACD Histogram, I am using the Fast Points set at 13, Slow Points at 26 and Smoothing at 9.
Ultimate Oscillator: The Ultimate Oscillator is falling and back negative.
- Settings: The Ultimate Oscillator settings are: Period 1 is 5, Period 2 is 10, Period 3 is 15, Factor 1 is 4, Factor 2 is 2 and Factor 3 is 1. These are not the default settings but are the settings I use with the S&P 500 chart set for 1 to 3 months.
Slow Stochastic: The Slow Stochastic has a down signal in place and is once again oversold.
Settings: For the Slow Stochastic I use the K period of 14 and D period of 3. The Slow Stochastic tries to predict the market direction further out than just one day.
Relative Strength Index: The RSI signal is falling and oversold.
- Settings: The relative strength index is set for a period of 5 which gives it 5 days of market movement to monitor. It is often the first indicator to show an overbought or oversold signal.
Rate of Change: The rate of change signal is at its lowest reading since the June sell-off and turning sideways.
- Settings: Rate Of Change is set for a 21 period. This indicator looks back 21 days and compares price action from the past to the present. With the Rate Of Change, prices are rising when signals are positive. Conversely, prices are falling when signals are negative. As an advance rises the Rate Of Change signal should also rise higher, otherwise the rally is suspect. A decline should see the Rate Of Change fall into negative signals. The more negative the signals the stronger the decline.
Support and Resistance Levels To Be Aware Of:
4000 is light resistance
3975 is light resistance and is a decline of 17.5%
3950 is light resistance
3925 is light resistance
3900 is light resistance
3875 is light support
3850 is light resistance
3825 is light support
3810 is good support
3800 is light support
3775 is light support
3750 is light support
3730 is light support
3700 is good support
3675 is light support
3650 is light support
3625 is light support
3600 is good support and is a decline of 25%
Stock Market Outlook for Tomorrow – Fri Sep 23 2022
For Friday the technical indicators are once again pointing to a potential bounce, but at the same time, signals are so bearish that a close nearer 3725 or 3710 is more likely.
Potential Market Moving Events
The biggest market moving event for the week was on Wednesday with the Fed’s rate hike and his news conference which led to the market sell-off.
Thursday:
8:30 Weekly Initial Unemployment Insurance Claims were stronger than expected coming in at 213,000.
8:30 Current account deficit was -4.0% in-line with estimates.
10:00 Leading economic indicators were -0.3%, not as weak as expected.
Friday:
9:45 S&P US Manufacturing and services PMI
2:00 PM Fed Chair Powell is speaking at FedListens event. Nothing new is expected but you just never know what might slip out and send stocks lower or higher.
Stock Market Outlook Archives
Stock Market Outlook For Wed May 6 2026 – Choppy But Higher Still

Morning Investing Strategy Notes for Tue May 5 2026

Stock Market Outlook For Tue May 5 2026 – Overbought and Lower

Morning Investing Strategy Notes for Mon May 4 2026
Stock Market Outlook For Mon May 4 2026 – Dips Likely With Possible Lower Close

Morning Investing Strategy Notes for Fri May 1 2026
Stock Market Outlook For Fri May 1 2026 – Overbought But Higher

Morning Investing Strategy Notes for Thu Apr 30 2026
Stock Market Outlook For Thu Apr 30 2026 – Dips Likely Possible Lower Close
Morning Investing Strategy Notes for Wed Apr 29 2026
Stock Market Outlook For Wed Apr 29 2026 – Choppy But Higher Ahead Of More Earnings

Morning Investing Strategy Notes for Tue Apr 28 2026