

Prior Trading Day Summary
On Thursday the rally stalled ahead of Friday’s August non-farm payroll report. The stalling of the rally is not a concern but typical after 4 days of a strong rally and a major event due out today. Both indexes were primarily neutral by the close with a small loss on the SPX and small gain on the NASDAQ. Volumes rose during the day as investors positioned themselves for August’s payroll numbers.
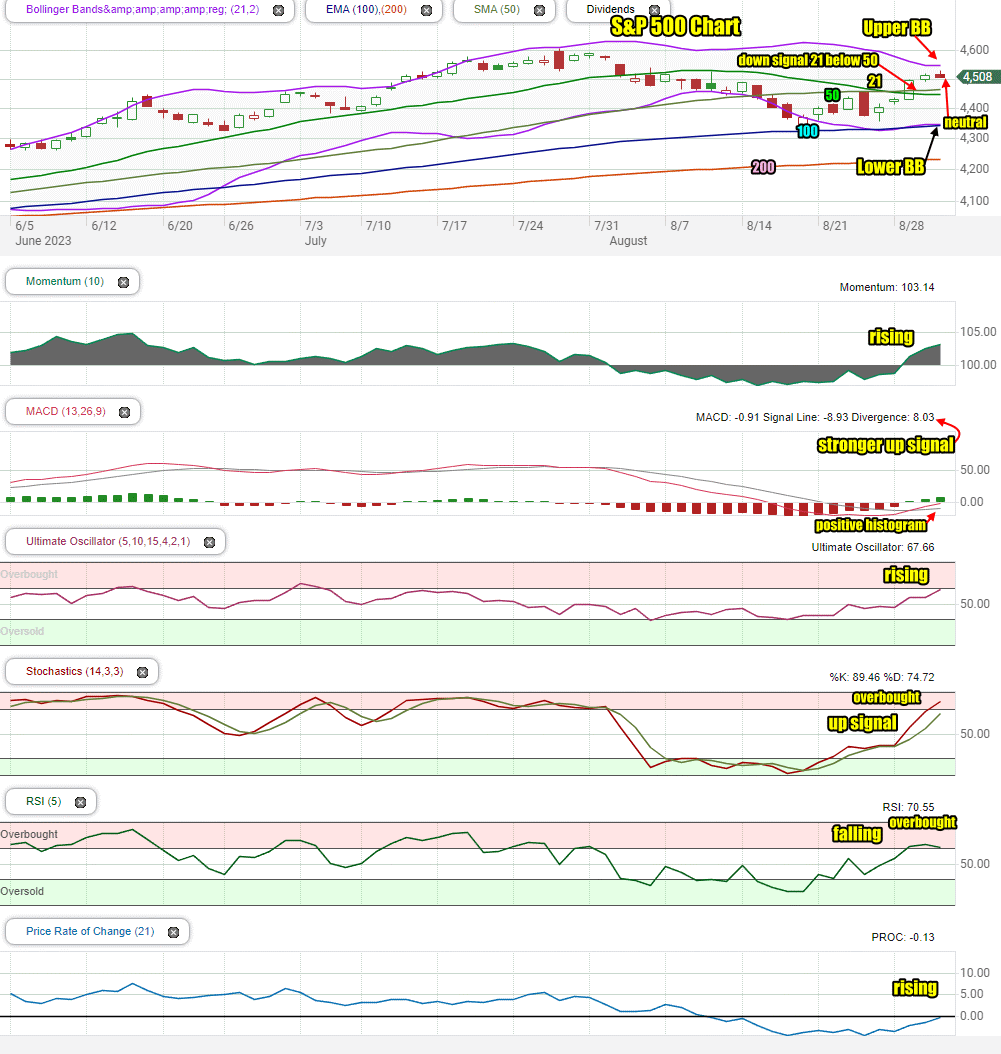
The S&P dipped 7 points to close at 4507.
The NASDAQ rose 15 points to end the day at 14,035.
Let’s review the SPX index from Thursday to see what to expect for Fri Sep 1 2023.
Stock Market Outlook: SPX Closing Chart For Thu Aug 31 2023
The index closed above the all major moving averages. for a third day. The 21 day continued to move lower below the 50 day for a down signal but this could change within a couple of days.
The closing candlestick on Thursday is neutral.
The 100 and 200 day moving averages are continuing to climb which is bullish and the 50 day is turned sideways.
The Lower Bollinger Band is turning higher and above the 100 day which is bullish. The Upper Bollinger Band is moving sideways which signals a potential Bollinger Bands Squeeze perhaps as early as Friday.
Stock Market Outlook review of Thu Aug 31 2023
Stock Market Outlook: Technical Indicators Review
Momentum: Momentum is rising and positive.
|
MACD Histogram: MACD (Moving Averages Convergence / Divergence) issued an up signal on Tue Aug 29 2023. On Thu Aug 31 2023 the up signal was stronger.
|
Ultimate Oscillator: The Ultimate Oscillator is rising and positive.
|
Slow Stochastic: The Slow Stochastic has an up signal in place and moving into overbought readings.
|
Relative Strength Index: The RSI signal is falling, positive and sitting at overbought readings.
|
Rate of Change: The rate of change signal is rising.
|
Stock Market Outlook: Support and Resistance Levels |
| 4600 is resistance |
| 4575 is resistance |
| 4550 is resistance |
| 4525 is resistance |
| 4500 is resistance |
| 4485 is resistance |
| 4470 is support |
| 4450 is support |
| 4435 is support |
| 4420 is support |
| 4400 is support |
| 4390 is support |
| 4370 is support |
| 4350 is support |
| 4340 is support |
| 4325 is support |
| 4310 is support |
| 4300 is support |
| 4290 is support |
| 4275 is support |
Stock Market Outlook for Fri Sep 1 2023
The opening on Friday will be all about the August non-farm payroll numbers. But after the initial reaction, which could include a rise or drop in Treasury yields, the technical indicators will have more sway.
As of Thursday’s close, the technical outlook is bullish. For that reason unless the August payroll numbers are a disaster, which is highly unlikely, I am expecting a move still higher, even if not on Friday, then on Monday.
Potential Economic and Political Market Moving Events
This week’s final major event is today with the non-farm payroll numbers for August.
Friday:
8:30 August non-farm payroll report – estimates are for 170,000 jobs to have been created which is lower than July’s 187,000.
8:30 Unemployment rate is expected to be unchanged at 3.5%
8:30 Hourly wages are expected to have rise 0.3%, lower than 0.4% for July.
9:45 Manufacturing Pm is expected to be unchanged at 47.
10:00 ISM manufacturing is expected to be unchanged at 46.6%
10:00 Construction spending is also expected to be unchanged at 0.5%