
For much of the past couple of weeks on the Market Breadth Indicator Outlook, I have been talking about the lack of breadth which was obvious to members who could each day review the advance decline, volume and percentage of stocks participating in the rally. It was obvious on Wednesday when the market gave back the morning rally that almost made a new all-time high, that something was not working in the overall market. That something was participation. We saw the results of the lack of participation today as the indexes slipped rather easily lower. Selling volume at first was light but quickly grew and at times heavier volumes pointed to a degree of panic especially once the S&P slid below the 2900 level.
On Thursday we may have seen the market finally decide to move lower to find better strength before trying again to make new highs. A day like Thursday though is rarely a one day event. Let’s look at the technical indicators to see what they might tell us to expect for tomorrow, Fri Oct 5 2018.
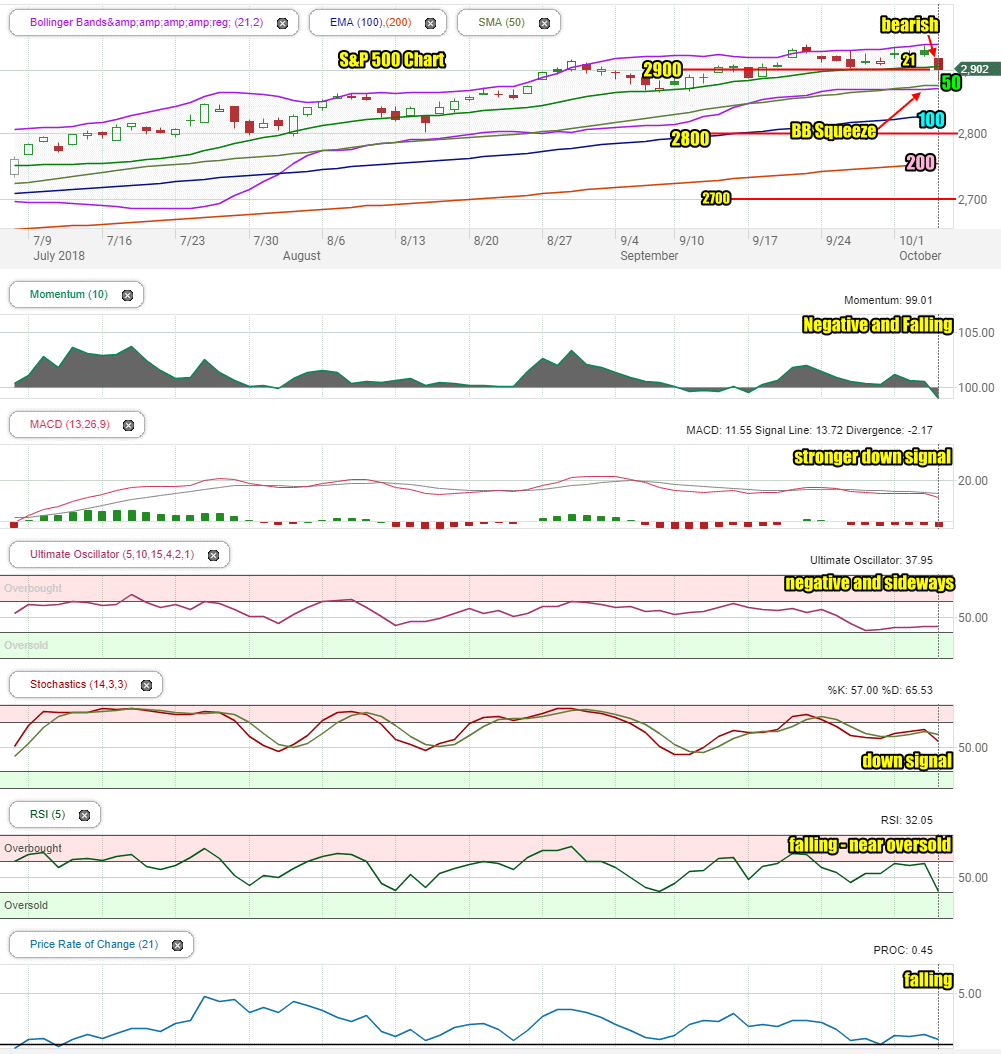
Stock Market Outlook Chart Comments At The Close on Thu Oct 4 2018
The S&P broke through the 21 day moving average and fell almost to the 50 day moving average. The index recovered from the drop toward the 50 day but could not retake the 21 day moving average.
This left behind a bearish candlestick for Friday but the recovery from falling almost to the 50 day and not closing at the lows means the SPX has a chance to bounce on Friday.
The Bollinger Bands Squeeze has not changed and the Upper Bollinger Band and Lower Bollinger Band still point to the squeeze ending next week.
The 21 day and 50 day moving averages are starting to turn sideways but the 100 and 200 day moving averages are still climbing.
Despite the drop today, the chart is still somewhat bullish but a close below 2900 seems imminent and that will change the short-term outlook to bearish.
Stock Market Outlook review of Thu Oct 4 2018
Stock Market Outlook: Technical Indicators Review:
Momentum: Momentum is negative and falling.
- Settings: For momentum I use a 10 period when studying market direction.
MACD Histogram: MACD (Moving Averages Convergence / Divergence) issued a down signal on Wednesday Sep 26. The down signal was far stronger on Thursday and points to more weakness on Friday.
- Settings: For MACD Histogram, I am using the Fast Points set at 13, Slow Points at 26 and Smoothing at 9.
Ultimate Oscillator: The Ultimate Oscillator signal is negative but it is trending more sideways than up or down so at this point it is not indicating either a move lower or higher is about to happen.
- Settings: The Ultimate Oscillator settings are: Period 1 is 5, Period 2 is 10, Period 3 is 15, Factor 1 is 4, Factor 2 is 2 and Factor 3 is 1. These are not the default settings but are the settings I use with the S&P 500 chart set for 1 to 3 months.
Slow Stochastic: The Slow Stochastic still now has a strong down signal in place. This signal looks out more than a single day and as such we could see more weakness next week, especially at the start of the week.
- Settings: For the Slow Stochastic I use the K period of 14 and D period of 3. The Slow Stochastic tries to predict the market direction further out than just one day.
Relative Strength Index: The RSI signal is lower and near oversold. A bounce back could happen at any time when the RSI is this low.
- Settings: The relative strength index is set for a period of 5 which gives it 5 days of market movement to monitor. It is often the first indicator to show an overbought or oversold signal.
Rate of Change: The rate of change signal is falling indicating lower prices are ahead for the S&P.
- Settings: Rate Of Change is set for a 21 period. This indicator looks back 21 days and compares price action from the past to the present. With the Rate Of Change, prices are rising when signals are positive. Conversely, prices are falling when signals are negative. As an advance rises the Rate Of Change signal should also rise higher, otherwise the rally is suspect. A decline should see the Rate Of Change fall into negative signals. The more negative the signals the stronger the decline.
Support Levels To Be Aware Of:
2900 is good support.
2860 is good support
2830 is light support
2795 is light support
2745 to 2750 is light support
2725 is light support.
2700 is support.
2675 is light support.
2650 is light support
2620 is light support
2600 is strong support.
There is good support at the 2550 level from where the market bounced back from the recent correction low on Feb 9.
The S&P has light support at 2480. It also has light support at 2450 and good support at 2425. Below that there is some support at 2400, 2380, 2350. 2300 has the most support at present but would represent a full correction as a drop to this level would be 20% and just 5% away from a potential bear market signal.
Stock Market Outlook for Tomorrow – Fri Oct 5 2018
The market has not had a correction worth mentioning, for months. The last correction of any magnitude was in March to April. We had some stronger down days. Intraday on Thursday, the S&P was seeing losses as great as those in April during that correction, but the recover today into the close left the S&P with a down day that still did not compare to April’s pullback. With no correction since then, the S&P is probably due to pullback and find some support with which to mount another rally.
Friday should see the index try to bounce but it will fail and the index will pullback. If on Friday the rally is strong enough to leave the end of the day with a positive close, Monday should see the index give it back and close lower. A move down to the 50 day moving average usually sees a retest and then a “tug-of-war” at the 50 day. If that happens next week, then the market may not fall much below the 50 day before regaining momentum to the upside. However, if the S&P slips below the 50 day moving average easily in the next couple of trading sessions, then this could be a bigger correction that might try to reach the 100 day. At this point no one can judge with any certainty where the index is heading if it breaks the 50 day.
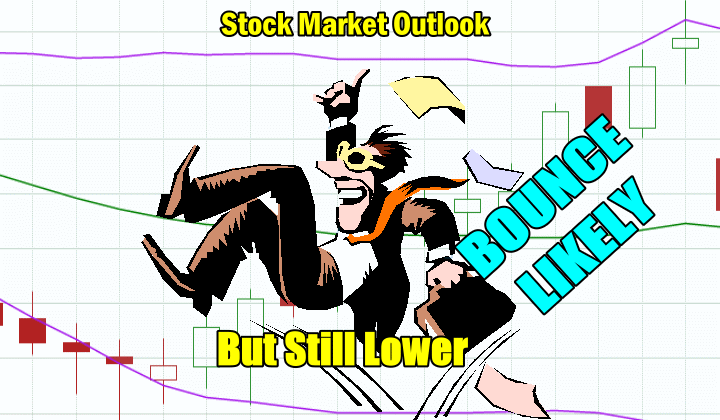
However for Friday I don’t think that will be the case. The outlook is for a bounce attempt that fails. Monday could be the day for the index to test the 50 day and close near it. I will know more on Friday after the close. Until then stay cautious but look for opportunities and start making a watch list. Most corrections last 10 to 20 trading days. If this is a correction, there will be plenty of opportunity to work on a watch list. It won’t be long before we know if this is a “blip” or a “bump” in the ongoing bull market. We will get more answers in the next couple of trading days.
Stock Market Outlook Archives
Stock Market Outlook For Wed May 6 2026 – Choppy But Higher Still

Morning Investing Strategy Notes for Tue May 5 2026

Stock Market Outlook For Tue May 5 2026 – Overbought and Lower

Morning Investing Strategy Notes for Mon May 4 2026
Stock Market Outlook For Mon May 4 2026 – Dips Likely With Possible Lower Close

Morning Investing Strategy Notes for Fri May 1 2026
Stock Market Outlook For Fri May 1 2026 – Overbought But Higher

Morning Investing Strategy Notes for Thu Apr 30 2026
Stock Market Outlook For Thu Apr 30 2026 – Dips Likely Possible Lower Close
Morning Investing Strategy Notes for Wed Apr 29 2026
Stock Market Outlook For Wed Apr 29 2026 – Choppy But Higher Ahead Of More Earnings

Morning Investing Strategy Notes for Tue Apr 28 2026