
 Prior Trading Day Summary
On Thu Oct 26 2023 indexes attempted a bounce which failed and the index dropped 49 points for another 1.18% loss. The index closed at 4137. So far there has been no attempt to retake the 200 day moving average or even try to reach it. The selling has been steady which drives buyers to keep moving lower.
The NASDAQ fell 225 points to end the day at 12,595. This places the NASDAQ back at the same level it was trading at during May 23 to May 24.
The day though was not as bearish as we saw on Wednesday. The S&P saw 46% of all stocks rising and the NASDAQ had 43% of all stocks moving higher. This is in stark contrast to yesterday when the SPX has 20% of stocks rising and the NASDAQ just 25% were rising.
Stocks remain very oversold. Once a bounce starts we should see more buying occur, but until then, buyers are sitting on the sidelines, watching stocks move lower. The lower they fall, the larger the profit will be in a rally. A lot of investors have the patience to wait.
Let’s review the closing technical indicators from Thu Oct 26 2023 to see what to expect for Fri Oct 27 2023.
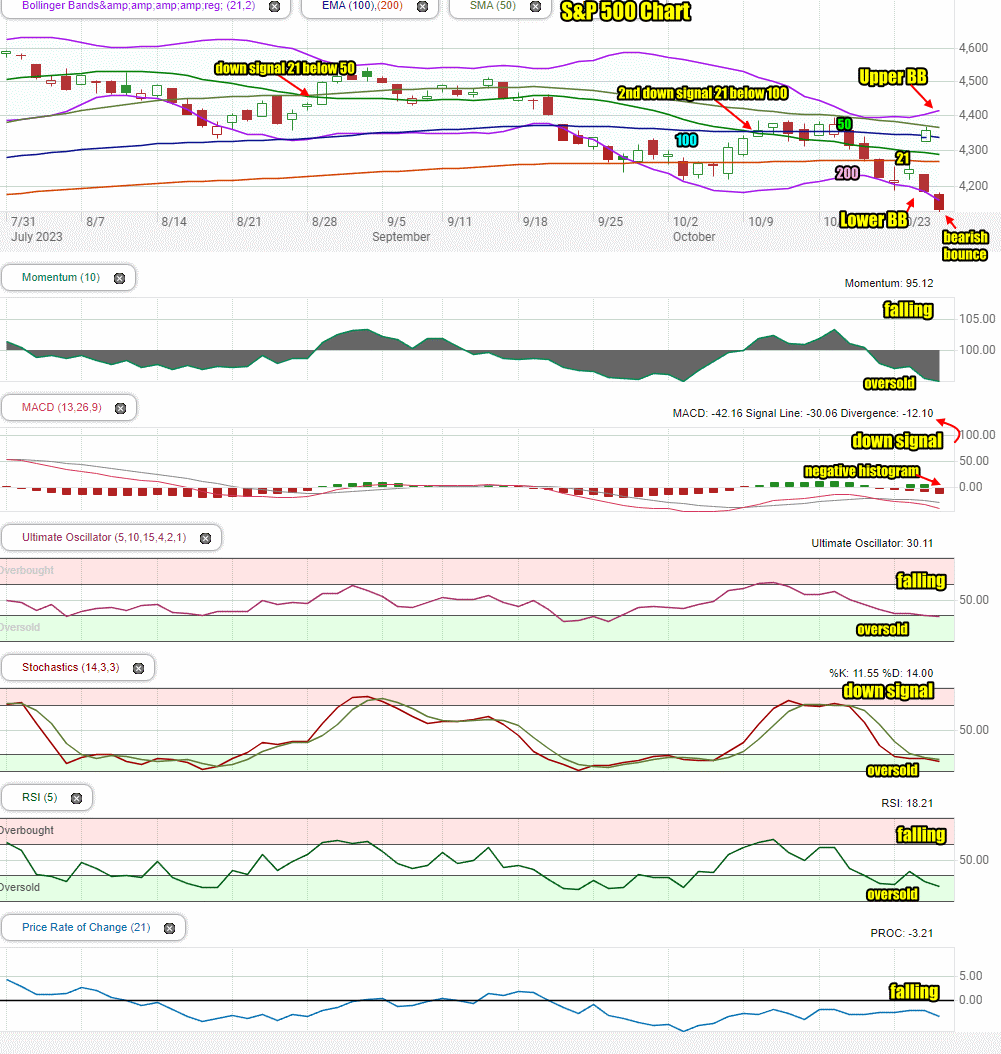
Stock Market Outlook: SPX Closing Chart For Thu Oct 26 2023
The index closed below all major moving averages which is bearish. The closing candlestick ended the day at the Lower Bollinger Band which is bearish.
However the closing candlestick continues to point to a potential bounce attempt once again for Friday.
The 21, 50 and 100 day moving averages are all falling. This is bearish. The 21 day moving average is falling to the 200 day. If it moves below it, this will be another bearish signal. The 200 day moving average is turning sideways which is bearish.
The Lower Bollinger Band is turning lower which is bearish and could signal more downside to come. The Upper Bollinger Band turned back up as the Bollinger Bands Squeeze is ended.
The S&P chart is quite bearish but as we have seen since Wednesday, the closing candlestick is also advising a bounce could happen at any time.
Stock Market Outlook review of Thu Oct 26 2023
Stock Market Outlook: Technical Indicators Review
Momentum: Momentum is falling, negative and very oversold.
|
MACD Histogram: MACD (Moving Averages Convergence / Divergence) issued a down signal on Fri Oct 20 2023. On Thu Oct 26 2023 the down signal was stronger.
|
Ultimate Oscillator: The Ultimate Oscillator is falling and negative. It is oversold.
|
Slow Stochastic: The Slow Stochastic has a down signal in place and falling. It is oversold.
|
Relative Strength Index: The RSI signal is falling and negative. It is oversold.
|
Rate of Change: The rate of change signal is falling and negative.
|
Stock Market Outlook: Support and Resistance Levels |
| 4400 is resistance |
| 4390 is resistance |
| 4370 is resistance |
| 4350 is resistance |
| 4325 is resistance |
| 4300 is resistance |
| 4275 is resistance |
| 4250 is resistance |
| 4235 is support |
| 4225 is support |
| 4200 is good support |
| 4185 is support |
| 4175 is support |
| 4150 is good support |
| 4135 is support |
| 4125 is support |
| 4115 is support |
| 4100 is support |
Stock Market Outlook for Fri Oct 27 2023
The technical indicators for Friday as still signaling more downside for stocks. As more of them become very oversold, the chance of a bounce grows. The problem remains Treasury yields. The fact that economic signals are showing the economy is remaining resilient is not helping the bulls or interest rates. Therefore a bounce is likely at any time but the chance of the downturn ending abruptly is unlikely with interest rates still rising.
Signs are advising to stay cautious and take profits when they present themselves and place less capital back into trades until there is a solid up signal in the index. Any bounce at present is not an up signal.
On Thursday the economic indicators were supportive of the economy continuing to grow which means a decline in inflation is unlikely in the near future. You can see the economic reports below under the heading Thursday.
Today we get Personal income and the PCE latest numbers. These could move the market lower.
Potential Economic and Political Market Moving Events
The most important reports this week are services PMI on Tuesday, durable goods orders on Thursday and PCE on Friday. Any of these could move markets.
Monday:
There are no economic reports
Tuesday:
9:45 S&P flash US services PMI s expected to be 49.9 but came in at 50.9
9:45 S&P flash US manufacturing PMI is expected to be 49.0 but came in at 50
Wednesday:
10:00 New home sales are estimated to have rise to 680,000 from 675,000 prior. Instead they rose to 759,000 defying analysts.
Thursday:
8:30 GDP – a number above 4.7% could send stocks lower. It came in at 4.9%.
8:30 Weekly Initial Unemployment Insurance Claims are expected to rise to 207,000. A higher number will be negative for stocks. It came in at 210,000.
8:30 Durable goods orders are expected to rise to 2%. A higher number will be negative for stocks. It came in at 4.7%.
8:30 Trade balance in goods came in at $85.8 billion.
8:30 Advanced retail and wholesale inventories came in at 0.9% and 0% respectively.
10:00 Pending home sales are expected to rise to -1.5% from -7.1%. Instead they rose to 1.1%, surprising analysts with their strength.
Friday:
8:30 Personal income is estimated to be 0.4%
8:30 Personal spending is expected to rise to 0.5%. A higher number will be negative for stocks.
8:30 PCE Index is expected to be 0.4%
8:30 Core PCE Index is expected to be 3.5%
8:30 Core PCE year-over-year is estimated to fall to 3.7%
10:00 Consumer sentiment is estimated at 63, unchanged.