

The market was incredibly oversold by the close of trading on Wednesday and thanks to Microsoft, Intel, Visa, Tesla, Whirlpool and Adobe among others, the indexes moved higher as better than expected earnings from Microsoft, Intel, Tesla, Whirlpool and others, had investors back buying many stocks. The rally was fairly broad based, but the underlying conditions saw no changes.
After hours Amazon earnings disappointed as did Alphabet which will send some shocks through the market on Friday.
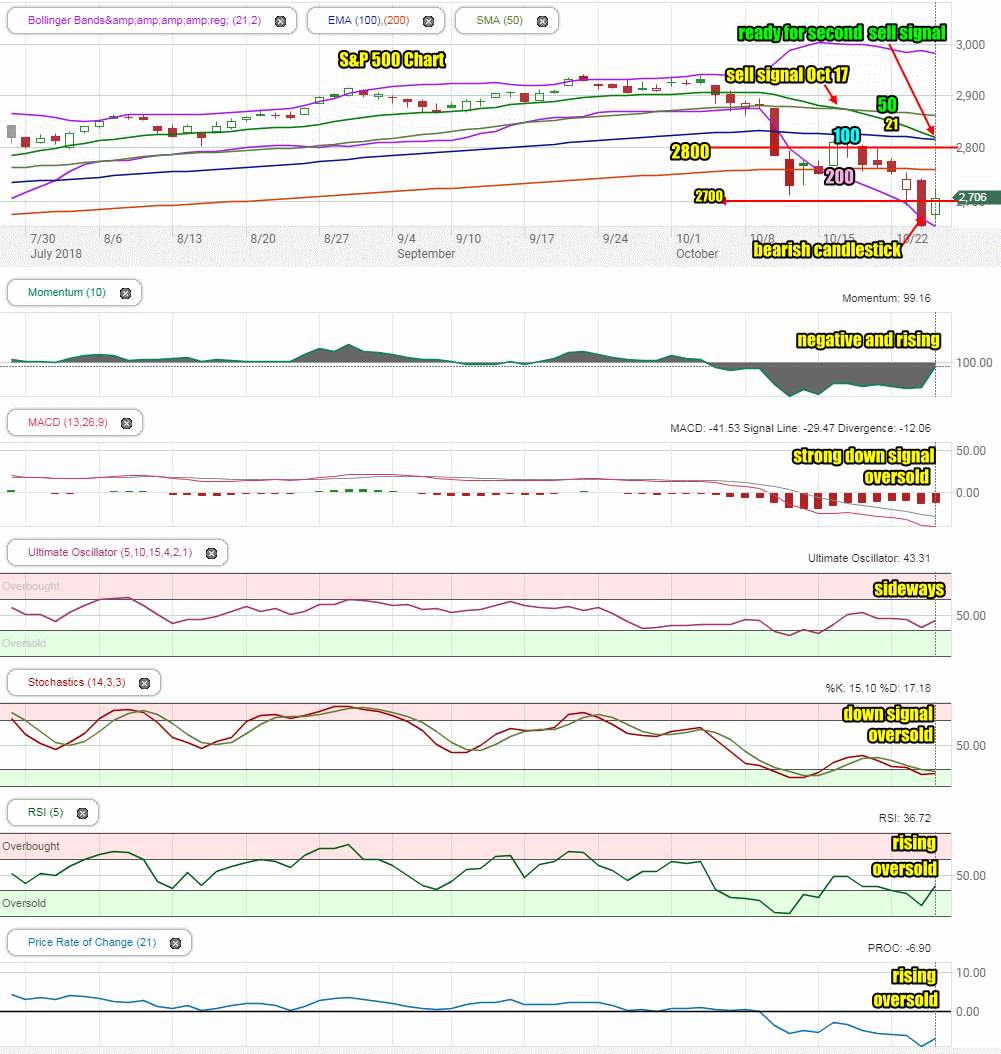
Stock Market Outlook Chart Comments At The Close on Thu Oct 25 2018
The index closed well below the 200 day moving average again on Thursday. What is more important is the 21 day continued to fall and is ready to drop below the 100 day moving average which will give us a second major down signal.
The rally was great to see but it did not change the chart pattern except it closed inside the Lower Bollinger Band but the band itself is still falling which indicates more downside is still to come.
The closing candlestick is bearish for Friday.
This is the fourth biggest one day drop this year with Feb 8 still holding that distinction with its 101 point drop and Oct 10 with the second biggest at 94 points. The third biggest was Feb 8 with a 92 point drop.
All the major moving averages are continuing lower. The chart is quite bearish.
Stock Market Outlook review of Thu Oct 25 2018
Stock Market Outlook: Technical Indicators Review:
All indicators continue to signal lower as of Wednesday’s close.
Momentum: Momentum is negative but rose on Thursday..
- Settings: For momentum I use a 10 period when studying market direction.
MACD Histogram: MACD (Moving Averages Convergence / Divergence) issued a down signal on Wednesday Sep 26. The signal was strong on Thursday and is at levels usually associated with a bounce commencing.
- Settings: For MACD Histogram, I am using the Fast Points set at 13, Slow Points at 26 and Smoothing at 9.
Ultimate Oscillator: The Ultimate Oscillator signal is moving sideways.
- Settings: The Ultimate Oscillator settings are: Period 1 is 5, Period 2 is 10, Period 3 is 15, Factor 1 is 4, Factor 2 is 2 and Factor 3 is 1. These are not the default settings but are the settings I use with the S&P 500 chart set for 1 to 3 months.
Slow Stochastic: The Slow Stochastic has a weak down signal in place for Friday and is deeply oversold. Normally a bounce will follow such readings.
- Settings: For the Slow Stochastic I use the K period of 14 and D period of 3. The Slow Stochastic tries to predict the market direction further out than just one day.
Relative Strength Index: The RSI signal rose from oversold on Thursday.
- Settings: The relative strength index is set for a period of 5 which gives it 5 days of market movement to monitor. It is often the first indicator to show an overbought or oversold signal.
Rate of Change: The rate of change signal rose on Thursday but is still somewhat oversold.
- Settings: Rate Of Change is set for a 21 period. This indicator looks back 21 days and compares price action from the past to the present. With the Rate Of Change, prices are rising when signals are positive. Conversely, prices are falling when signals are negative. As an advance rises the Rate Of Change signal should also rise higher, otherwise the rally is suspect. A decline should see the Rate Of Change fall into negative signals. The more negative the signals the stronger the decline.
Support Resistance Levels To Be Aware Of:
2900 was good support – this will be strong resistance
2860 was good support – this will be resistance
2830 was light support and will be light resistance
2795 is resistance
2745 to 2750 are light resistance
2725 is light resistance
2700 was important support and may be retaken again if there is a bounce.
2675 is light support and was broken on Wednesday.
2650 is light support which looks set to be tested on Thursday.
2620 is light support
2600 is strong support.
There is good support at the 2550 level from where the market bounced back from the recent correction low on Feb 9.
The S&P has light support at 2480. It also has light support at 2450 and good support at 2425. Below that there is some support at 2400, 2380, 2350.
2300 has the most support at present but would represent a full correction of 641 points as a drop to this level would be 21% and just 5% away from a bear market signal ending the bull market from 2009.
Stock Market Outlook for Tomorrow – Fri Oct 26 2018
The rally was great to see but it was a bounce. The indicators remain extremely bearish but some are still signaling oversold.
Technically the market is no longer holding any support levels. The rally on Thursday needs follow through and looking at the signals, that is not going to happen yet.
Instead the signals show that Friday will see another volatile day and a large drop should be expected. The S&P may not test 2600 on Friday but it will next week. For Friday a drop down to the lows of Thursday should be anticipated but perhaps we will be lucky and those lows will hold up.
Stock Market Outlook Archives
Stock Market Outlook For Wed May 6 2026 – Choppy But Higher Still

Morning Investing Strategy Notes for Tue May 5 2026

Stock Market Outlook For Tue May 5 2026 – Overbought and Lower

Morning Investing Strategy Notes for Mon May 4 2026
Stock Market Outlook For Mon May 4 2026 – Dips Likely With Possible Lower Close

Morning Investing Strategy Notes for Fri May 1 2026
Stock Market Outlook For Fri May 1 2026 – Overbought But Higher

Morning Investing Strategy Notes for Thu Apr 30 2026
Stock Market Outlook For Thu Apr 30 2026 – Dips Likely Possible Lower Close
Morning Investing Strategy Notes for Wed Apr 29 2026
Stock Market Outlook For Wed Apr 29 2026 – Choppy But Higher Ahead Of More Earnings

Morning Investing Strategy Notes for Tue Apr 28 2026