

Thursday saw a choppier day of trading with the S&P sinking at one point to 4526 and then in the after making a new all-time high of 4551 and a new closing high of 4549.
The NASDAQ rose 94 points to close at 15215, just 188 points from the all-time high. It was a wild day with lots of whipsaws, dips and spikes and volumes rose including the best volume on the NASDAQ since September 30.
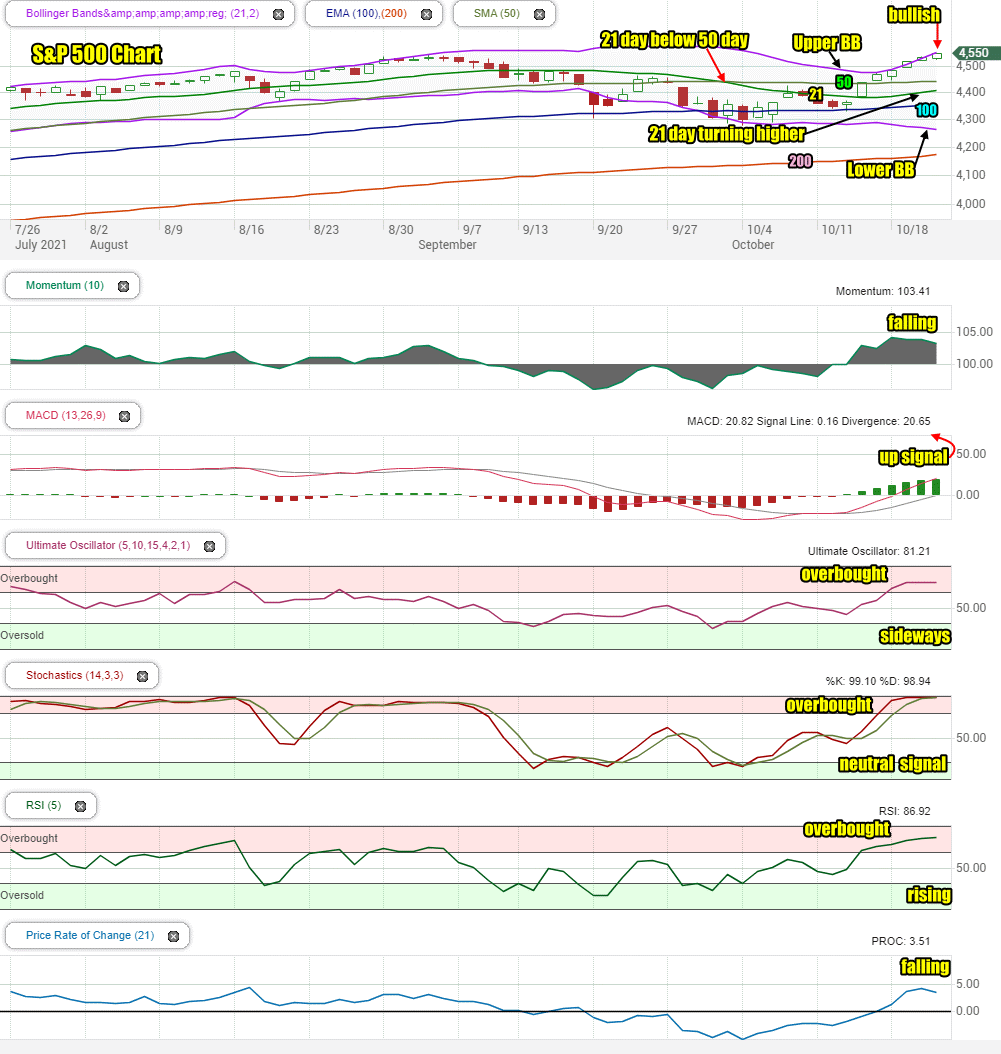
Let’s review the closing technical indicators from Thu Oct 21 to see where Friday is headed.
Stock Market Outlook Chart Comments At The Close on Thu Oct 21 2021
The index closed just inside the Upper Bollinger Band continuing to signal an overbought market. This though is bullish as it continues to show buyers are bringing capital into the markets.
The downturn of just 2 weeks ago is long forgotten. The markets are overheated heading into Friday.
Thursday’s closing candlestick is signaling a day of tight trading for Friday but still a high probability of a positive close, even a small one.
The Upper Bollinger Band is still rising and the Lower Bollinger Band is still falling, both of which is bullish.
The 21 day moving average which fell below the 50 day last week, is turning higher and could cross above the 50 day shortly. This is bullish.
The 50 day is also turning higher as is the 100 and 200 day moving averages. This is bullish.
For Friday the only bearish concern is the closing candlestick warning of a tight trading day for Friday as many stocks remain overbought at present.
Stock Market Outlook review of Thu Oct 21 2021
Stock Market Outlook: Technical Indicators Review:
Momentum: Momentum is dipping back, losing strength but positive.
- Settings: For momentum I use a 10 period when studying market direction.
MACD Histogram: MACD (Moving Averages Convergence / Divergence) issued an up signal on Wed Oct 13 2021 . On Thu Oct 21 the up signal was stronger again which indicates more upside ahead but also now into very overbought levels.
- Settings: For MACD Histogram, I am using the Fast Points set at 13, Slow Points at 26 and Smoothing at 9.
Ultimate Oscillator: The Ultimate Oscillator is trending sideways and signaling overbought.
- Settings: The Ultimate Oscillator settings are: Period 1 is 5, Period 2 is 10, Period 3 is 15, Factor 1 is 4, Factor 2 is 2 and Factor 3 is 1. These are not the default settings but are the settings I use with the S&P 500 chart set for 1 to 3 months.
Slow Stochastic: The Slow Stochastic has a neutral signal in place and is holding extreme overbought readings.
Settings: For the Slow Stochastic I use the K period of 14 and D period of 3. The Slow Stochastic tries to predict the market direction further out than just one day.
Relative Strength Index: The RSI signal is rising for a seventh day and into overbought readings.
- Settings: The relative strength index is set for a period of 5 which gives it 5 days of market movement to monitor. It is often the first indicator to show an overbought or oversold signal.
Rate of Change: The rate of change signal is falling.
- Settings: Rate Of Change is set for a 21 period. This indicator looks back 21 days and compares price action from the past to the present. With the Rate Of Change, prices are rising when signals are positive. Conversely, prices are falling when signals are negative. As an advance rises the Rate Of Change signal should also rise higher, otherwise the rally is suspect. A decline should see the Rate Of Change fall into negative signals. The more negative the signals the stronger the decline.
Support and Resistance Levels To Be Aware Of:
4550 is resistance
4525 is resistance
4500 is support
4490 is support
4475 is support
4450 is support
4400 is support
4370 is light support
4350 is light support
4300 is light support
4290 is light support
4270 is light support
4250 is good support
4225 is light support
4200 is good support
4175 is light support
4150 is light support
4100 is good support
Stock Market Outlook for Tomorrow – Fri Oct 22 2021
For Friday markets remain extremely overbought but investors are continuing to buy stocks and push many higher. Technical signals warn of a tight trading range on Friday and a chance for a negative close. Whatever the case, the market is strongly bullish and a negative close on Friday will not end the rally. Instead it will help consolidate recent gains. Almost equally, there is still a chance for another positive close although Thursday’s closing candlestick warns that any positive close on Friday, will be a small one. With a strong week of gains we may find a lot of investors taking some profits ahead of the weekend. That could cause a few dips but once again they will be opportunities to setup trades.
Stock Market Outlook Archives
Stock Market Outlook For Wed May 6 2026 – Choppy But Higher Still

Morning Investing Strategy Notes for Tue May 5 2026

Stock Market Outlook For Tue May 5 2026 – Overbought and Lower

Morning Investing Strategy Notes for Mon May 4 2026
Stock Market Outlook For Mon May 4 2026 – Dips Likely With Possible Lower Close

Morning Investing Strategy Notes for Fri May 1 2026
Stock Market Outlook For Fri May 1 2026 – Overbought But Higher

Morning Investing Strategy Notes for Thu Apr 30 2026
Stock Market Outlook For Thu Apr 30 2026 – Dips Likely Possible Lower Close
Morning Investing Strategy Notes for Wed Apr 29 2026
Stock Market Outlook For Wed Apr 29 2026 – Choppy But Higher Ahead Of More Earnings

Morning Investing Strategy Notes for Tue Apr 28 2026