
What Happened On Wed Nov 22 2017
On Wed Nov 22 2017 the indexes came under selling pressure. This though was expected following the big jump on Tuesday.
The NASDAQ managed a small gain and the S&P ended with a very small loss. The Dow Jones however lost 0.27% closing down 64 points on the day. The NASDAQ made another new high.
Closing Statistics for Wed Nov 22 2017
S&P 500 Index Close
The S&P index ended down 1.95 to 2597.08
Dow Jones Index Close
The Dow Jones ended down 644.65 to 23,526.18
NASDAQ Index Close
The NASDAQ closed up 4.88 to 6867.36
Stock Market Outlook – Review of Wed Nov 22 2017
Stock Market Outlook review of Wed Nov 22 2017
Chart Comments At The Close:
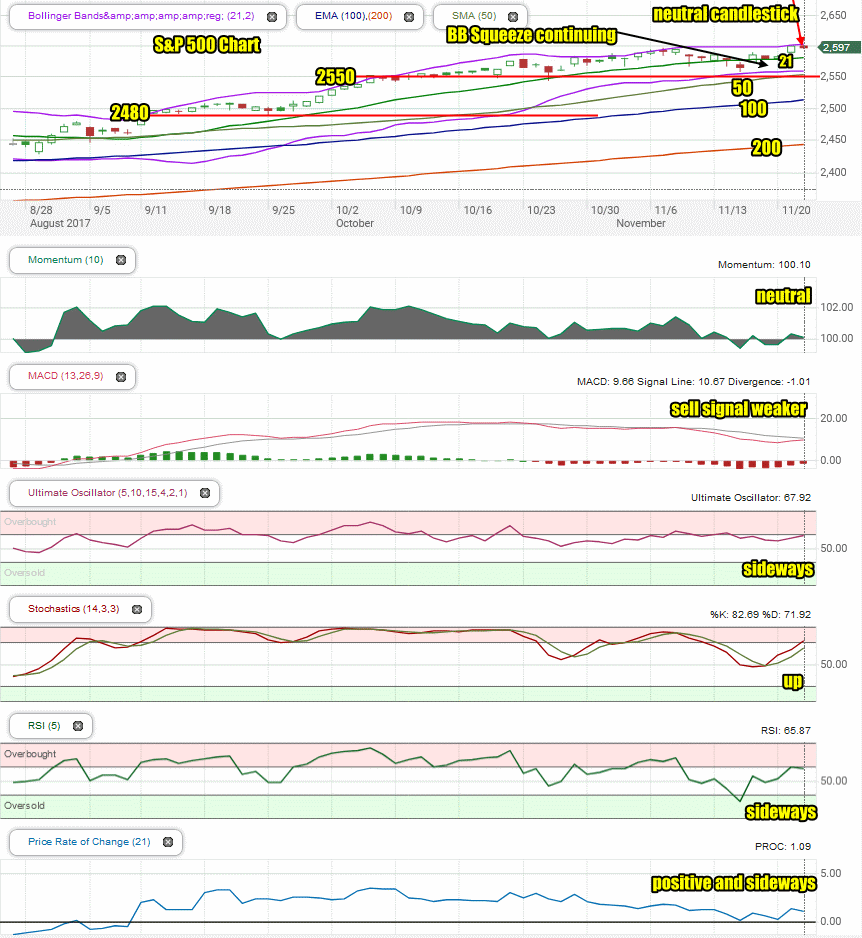
On Wednesday the S&P dipped slightly but managed to comeback and closed down just a couple of points. This left behind a neutral candlestick meaning the market could move either way.
The index is above the 21 day moving average which is bullish.
The Bollinger Bands Squeeze is still continuing but is also showing some signs that it may end next week, as the Upper Bollinger Band and Lower Bollinger Band continued to widen on Wednesday. This would indicate the squeeze will end with the S&P moving higher.
All major moving averages are still climbing.
Stock Market Outlook: Technical Indicators:
Momentum: For momentum I use a 10 period when studying market direction. Momentum is neutral.
MACD Histogram: For MACD Histogram, I am using the Fast Points set at 13, Slow Points at 26 and Smoothing at 9. MACD (Moving Averages Convergence / Divergence) issued a sell signal on Oct 24. The sell signal is weaker again by the close on Wednesday.
Ultimate Oscillator: The Ultimate Oscillator settings are: Period 1 is 5, Period 2 is 10, Period 3 is 15, Factor 1 is 4, Factor 2 is 2 and Factor 3 is 1. These are not the default settings but are the settings I use with the S&P 500 chart set for 1 to 3 months. The Ultimate Oscillator signal is positive and still trending sideways.
Slow Stochastic: For the Slow Stochastic I use the K period of 14 and D period of 3. The Slow Stochastic tries to predict the market direction further out than just one day. The Slow Stochastic continues to point higher.
Relative Strength Index: The relative strength index is set for a period of 5 which gives it 5 days of market movement to monitor. It often is the first indicator to show an overbought or oversold signal. The RSI signal is sideways or unchanged for Friday.
Rate of Change: Rate Of Change is set for a 21 period. This indicator looks back 21 days and compares price action from the past to the present. The rate of change signal is positive but pointing sideways indicating no change in prices are expected for Friday.
Support Levels To Be Aware Of:
There is support at the 2550 level which could assist in pushing the index higher in November.
The S&P has light support at 2480. It also has light support at 2450 and good support at 2425. Below that there is some support at 2400, 2380, 2350. 2300 has the most support at present.
Stock Market Outlook for Tomorrow – Fri Nov 24 2017
Friday is a half day with the Stock Markets closing at 1:00 PM.
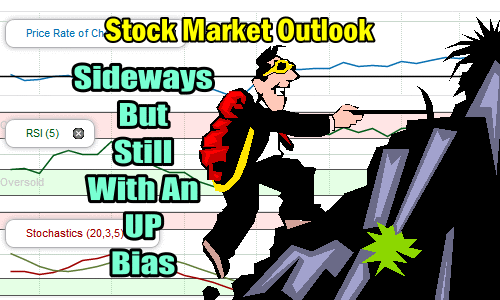
The technical indicators on Wednesday were generally pointing sideways for the remainder of the week. With Thursday being Thanksgiving holiday and Friday a half day, I am expecting low volumes and a sideways move. But in general the index is still positioned to move higher next week. One of the growing concerns in the Ultimate Oscillator that continues to trend sideways. There is no support from the Ultimate Oscillator for a bigger move higher and indeed, it did not support Tuesday’s rally. That is a signal to watch for the start of next week as it may be warning that the index will dip once again.
Market Direction Internal Links
Profiting From Understanding Market Direction (Articles Index)
Understanding Short-Term Signals
Market Direction Portfolio Trades (Members)
Market Direction External Links
IWM ETF Russell 2000 Fund Info
Market Direction SPY ETF 500 Fund Info