
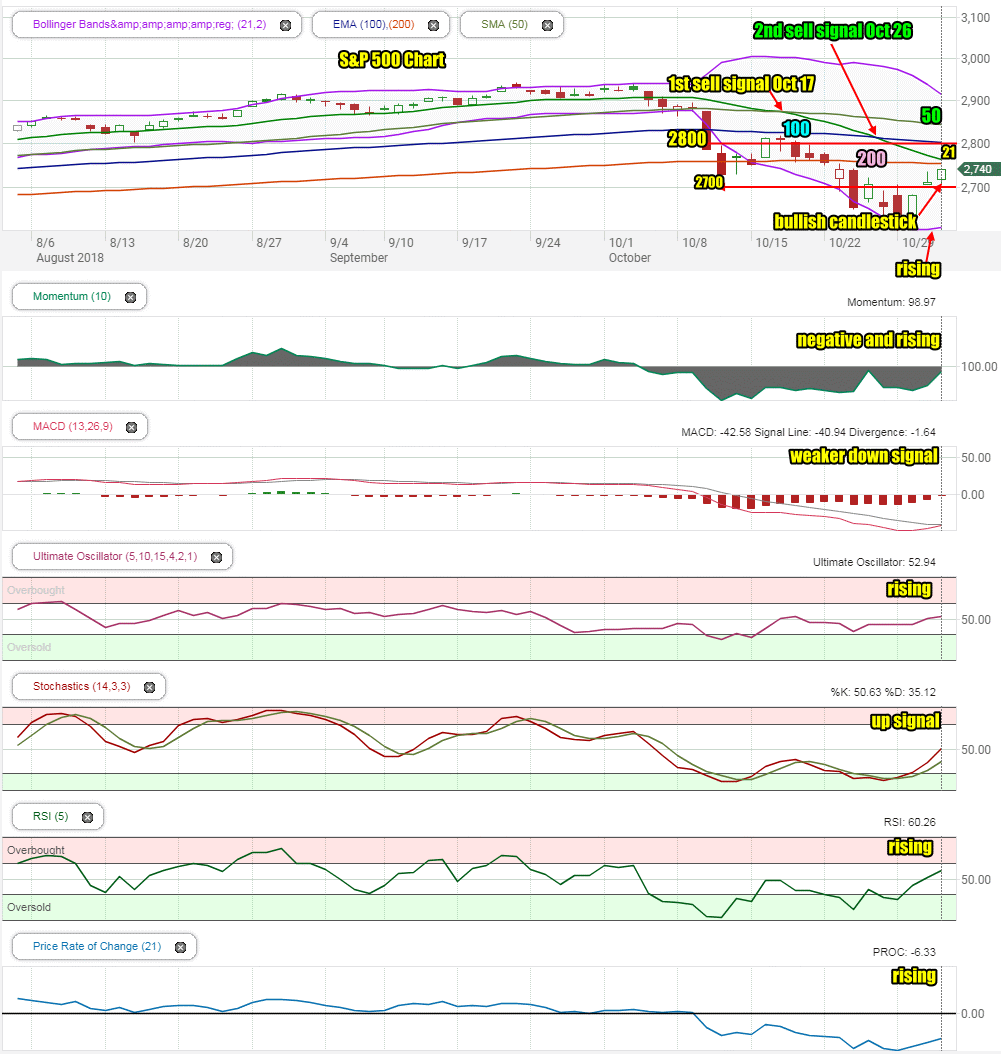
Thursday saw excellent volume again and all indexes stage a third day of rallying. This is now the best 3 day rally since April.
Stock Market Outlook Chart Comments At The Close on Thu Nov 1 2018
The index closed below the 200 day moving average on Thursday and at the highs of the day.
The candlestick for Friday is bullish although after 3 days of a rally and sitting just below the 200 day, we could see stocks dip back on Friday.
All the major moving averages are falling lower with the 21 day falling still closer to the 200 day moving average. If it crosses below it, the market will issue a third sell signal. Note though that the Lower Bollinger Bandis now rising, a bullish sign. Meanwhile the Upper Bollinger Band is still falling which we will have to keep an eye on as often this type of steep drop indicates a pullback may occur next week.
The close on Thursday has the S&P above 2710 at the 2740 level. This is the first break of the lower highs pattern.
Stock Market Outlook review of Thu Nov 1 2018
Stock Market Outlook: Technical Indicators Review:
Momentum: Momentum is negative and rising.
- Settings: For momentum I use a 10 period when studying market direction.
MACD Histogram: MACD (Moving Averages Convergence / Divergence) issued a down signal on Wednesday Sep 26. The down signal is almost gone at the close on Thursday and any up move on Friday will see an up signal generated.
- Settings: For MACD Histogram, I am using the Fast Points set at 13, Slow Points at 26 and Smoothing at 9.
Ultimate Oscillator: The Ultimate Oscillator signal is rising.
- Settings: The Ultimate Oscillator settings are: Period 1 is 5, Period 2 is 10, Period 3 is 15, Factor 1 is 4, Factor 2 is 2 and Factor 3 is 1. These are not the default settings but are the settings I use with the S&P 500 chart set for 1 to 3 months.
Slow Stochastic: The Slow Stochastic has a strong up signal in place for Friday.
- Settings: For the Slow Stochastic I use the K period of 14 and D period of 3. The Slow Stochastic tries to predict the market direction further out than just one day.
Relative Strength Index: The RSI signal is rising.
- Settings: The relative strength index is set for a period of 5 which gives it 5 days of market movement to monitor. It is often the first indicator to show an overbought or oversold signal.
Rate of Change: The rate of change signal is rising.
- Settings: Rate Of Change is set for a 21 period. This indicator looks back 21 days and compares price action from the past to the present. With the Rate Of Change, prices are rising when signals are positive. Conversely, prices are falling when signals are negative. As an advance rises the Rate Of Change signal should also rise higher, otherwise the rally is suspect. A decline should see the Rate Of Change fall into negative signals. The more negative the signals the stronger the decline.
Support Resistance Levels To Be Aware Of:
2900 was good support – this will be strong resistance
2860 was good support – this will be resistance
2830 was light support and will be light resistance
2795 is resistance
2745 to 2750 are light resistance
2725 was once support and needs to be held on Friday.
2700 is important support and was retaken on Wednesday.
2675 is light support.
2650 is light support.
2620 is light support.
2600 is strong support held the market up from the latest pullback in the correction.
There is good support at the 2550 level from where the market bounced back from the recent correction low on Feb 9.
The S&P has light support at 2480. It also has light support at 2450 and good support at 2425. Below that there is some support at 2400, 2380, 2350.
2300 has the most support at present but would represent a full correction of 641 points as a drop to this level would be 21% and just 5% away from a bear market signal ending the bull market from 2009.
Stock Market Outlook for Tomorrow – Fri Nov 2 2018
Friday will most likely see the market dip back although Apple’s earnings and/or the jobs numbers from October may be enough to keep the market from dipping.
The outlook is for some weakness, especially after 3 days of a strong rally. However Friday still looks steady enough for another positive close.
Stock Market Outlook Archives
Stock Market Outlook For Wed May 6 2026 – Choppy But Higher Still

Morning Investing Strategy Notes for Tue May 5 2026

Stock Market Outlook For Tue May 5 2026 – Overbought and Lower

Morning Investing Strategy Notes for Mon May 4 2026
Stock Market Outlook For Mon May 4 2026 – Dips Likely With Possible Lower Close

Morning Investing Strategy Notes for Fri May 1 2026
Stock Market Outlook For Fri May 1 2026 – Overbought But Higher

Morning Investing Strategy Notes for Thu Apr 30 2026
Stock Market Outlook For Thu Apr 30 2026 – Dips Likely Possible Lower Close
Morning Investing Strategy Notes for Wed Apr 29 2026
Stock Market Outlook For Wed Apr 29 2026 – Choppy But Higher Ahead Of More Earnings

Morning Investing Strategy Notes for Tue Apr 28 2026