

On Thursday investors sold stocks at the opening and bought them into the close.
The S&P closed down 12 points to 3946 and rallied from an intraday low of 3906.
The NASDAQ lost just 38 points to close at 11,145.
Let’s review the closing SPX technical indicators from Thursday to see what we should expect for Friday.
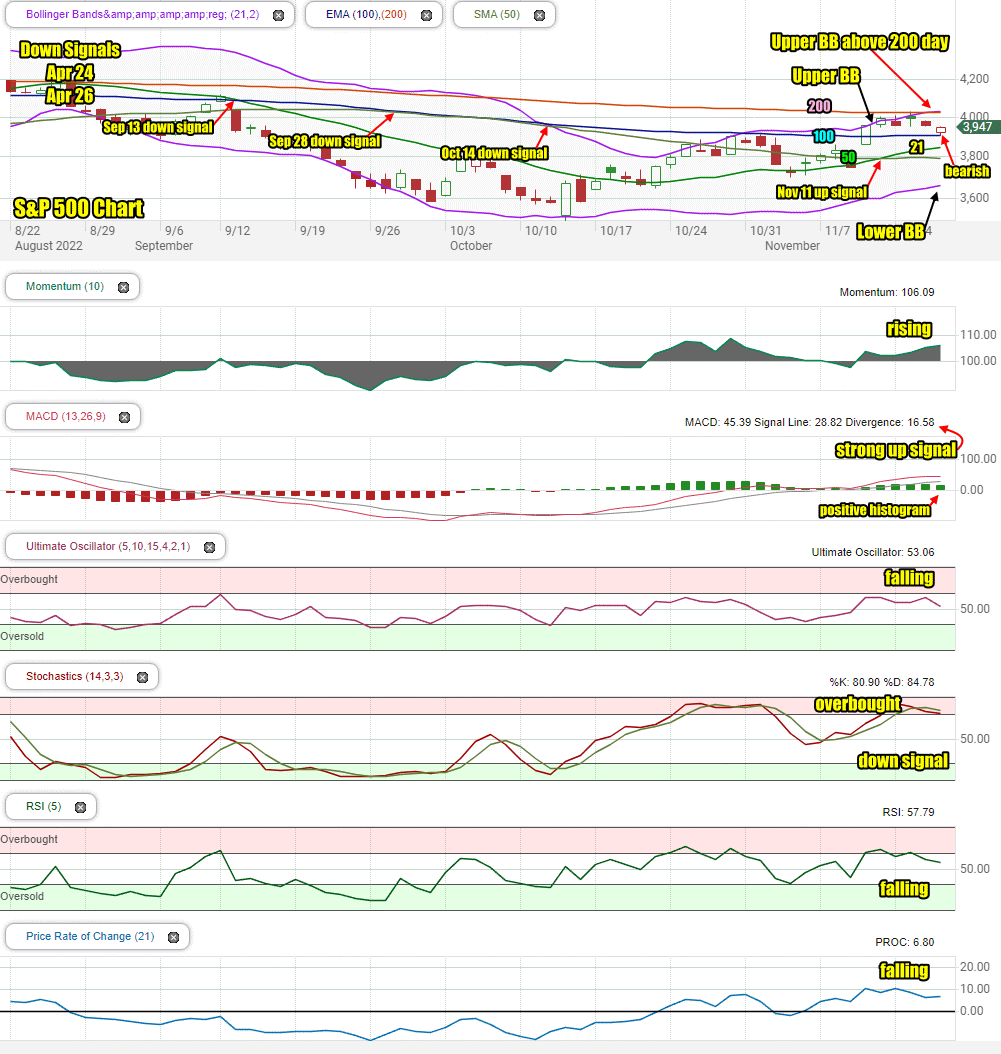
Stock Market Outlook Chart Comments At The Close on Thu Nov 17 2022
On Thursday the S&P closing candlestick is below the Upper Bollinger Band and the 200 day moving average but above the 21, 50 and 100 day moving averages. The closing candlestick is bearish for Friday.
The Upper Bollinger Band crossed above the 200 day on Wednesday which is a bullish signal.
The Lower Bollinger Band is continuing to climb, which is bullish.
A new up signal was generated on Friday Nov 11 as the 21 day moving average is back above the 50 day. This is bullish.
The 50 day moving average is back moving lower which is bearish. The 100 day is turning sideways which is bullish.
The 200 day moving average is still falling. This is bearish.
There are 6 down signals in place since April and one new up signal.
The chart is 60% bullish for Friday.
Stock Market Outlook review of Thu Nov 17 2022
Stock Market Outlook: Technical Indicators Review:
Momentum: Momentum is rising and positive.
- Settings: For momentum I use a 10 period when studying market direction.
MACD Histogram: MACD (Moving Averages Convergence / Divergence) issued an up signal on Thursday Oct 16. On Thursday the up signal lost some strength but remains with a strong up signal. The histogram also has a positive signal.
- Settings: For MACD Histogram, I am using the Fast Points set at 13, Slow Points at 26 and Smoothing at 9.
Ultimate Oscillator: The Ultimate Oscillator is falling.
- Settings: The Ultimate Oscillator settings are: Period 1 is 5, Period 2 is 10, Period 3 is 15, Factor 1 is 4, Factor 2 is 2 and Factor 3 is 1. These are not the default settings but are the settings I use with the S&P 500 chart set for 1 to 3 months.
Slow Stochastic: The Slow Stochastic has a down signal in place with overbought readings.
Settings: For the Slow Stochastic I use the K period of 14 and D period of 3. The Slow Stochastic tries to predict the market direction further out than just one day.
Relative Strength Index: The RSI signal is falling.
- Settings: The relative strength index is set for a period of 5 which gives it 5 days of market movement to monitor. It is often the first indicator to show an overbought or oversold signal.
Rate of Change: The rate of change signal is falling but positive.
- Settings: Rate Of Change is set for a 21 period. This indicator looks back 21 days and compares price action from the past to the present. With the Rate Of Change, prices are rising when signals are positive. Conversely, prices are falling when signals are negative. As an advance rises the Rate Of Change signal should also rise higher, otherwise the rally is suspect. A decline should see the Rate Of Change fall into negative signals. The more negative the signals the stronger the decline.
Support and Resistance Levels To Be Aware Of:
4100 is resistance
4090 is resistance
4070 is resistance
4050 is resistance
4030 is resistance
4025 is resistance
4000 is resistance
3975 is resistance
3965 is resistance
3950 is resistance
3925 is light support
3900 is light support
3875 is light support
3850 is light support
3825 is light support
3800 is good support
Stock Market Outlook for Tomorrow – Fri Nov 18 2022
The S&P chart is still quite strong but the technical indicators continue to lose some strength. While still positive, they are showing some weakness from four days of moving primarily sideways in the index. There are some slight overbought signals as well but none that would turn back down a rally.
The outlook for Friday is for another choppy day that will see dips and is weaker. Historically though the market could still rally slightly to end the week.
Traveling To Friends On Friday
I am taking Friday off to travel and for an early Thanksgiving dinner with some investor friends in Detroit. This is my first time visiting with these friends since 2019. I will not be posting on Friday but I have posted some trade ideas for Friday for members.
Black Friday Membership Special
I have received emails wondering if there will be a Black Friday Membership Special again this year. There will be a special starting later next week.
Potential Economic and Political Market Moving Events
Friday:
10:00 Leading economic indicators are expected to come in at -0.4% the same as in September.
10:00 Existing home sales are expected to drop to 4.37 million
Stock Market Outlook Archives
Stock Market Outlook For Wed May 6 2026 – Choppy But Higher Still

Morning Investing Strategy Notes for Tue May 5 2026

Stock Market Outlook For Tue May 5 2026 – Overbought and Lower

Morning Investing Strategy Notes for Mon May 4 2026
Stock Market Outlook For Mon May 4 2026 – Dips Likely With Possible Lower Close

Morning Investing Strategy Notes for Fri May 1 2026
Stock Market Outlook For Fri May 1 2026 – Overbought But Higher

Morning Investing Strategy Notes for Thu Apr 30 2026
Stock Market Outlook For Thu Apr 30 2026 – Dips Likely Possible Lower Close
Morning Investing Strategy Notes for Wed Apr 29 2026
Stock Market Outlook For Wed Apr 29 2026 – Choppy But Higher Ahead Of More Earnings

Morning Investing Strategy Notes for Tue Apr 28 2026