
 Prior Trading Day Summary
On Thursday investors took profits which resulted in a major move lower for most stocks. The spark was concerns that the Fed will not reduce interest rates further but instead may focus again on inflation. Meanwhile more companies continue to issue layoffs which many analysts believe are signs the economy is slowing and could enter a recession as early as the start of 2026.
The S&P fell 113 points to close at 6737. Volume was higher by 300 million shares to 5.6 billion. 77% of all stocks were falling and 79% of all volume was trading lower. For the week the index is up just 8 points.
The NASDAQ fell 536 points to close at 22,870. Volume jumped 2.8 billion shares to 11.7 billion. 78% of al stocks were falling. For the week the NASDAQ is down 123 points.
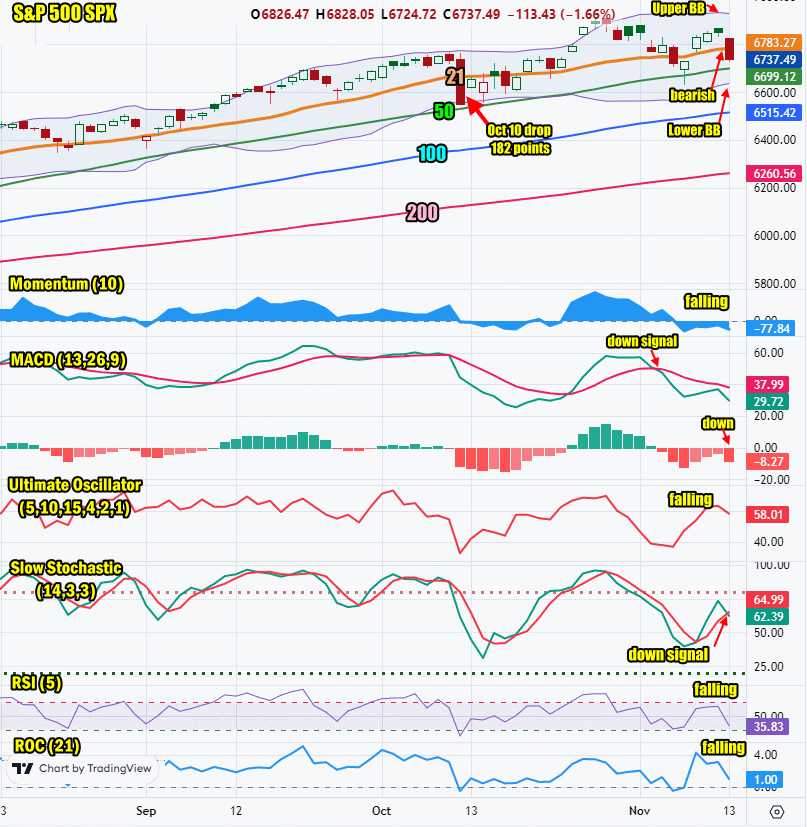
In the SPX chart below you can see the Oct 10 sell-off was 182 points and the index recovered to make a new all-time high on Oct 29 but note how choppy the trading has been following the Oct 10 sell-off. Often this is the type of trading action we see at an interim top. This means that even if Friday has a bounce for stocks, the market needs to consolidate and strengthen before moving still higher. Today’s sell-off might have been a warning but intraday the SPX bounced off the 50 day moving average, typical trading action. This is the third day since October 10 when the SPX has reached the 50 day. This is a definite sign of weakness.
Let’s review the closing technical indicators from Thu Nov 13 2025 to see whether there will be a bounce on Friday.
Stock Market Outlook: SPX Closing Chart For Thu Nov 13 2025
The index closed below the Upper Bollinger Band and 21 day moving average. This is bearish.
The closing candlestick is bearish for Friday but also is oversold and signaling a bounce could be possible but probably won’t hold.
The 21 day moving average is rising and closed at 6783 which is bullish.
The 50 day moving average is rising and closed at 6699 which is bullish.
The 100 day moving average is rising and closed at 6515 which is bullish.
The 200 day moving average is rising and closed at 6260 which is bullish.
The Lower Bollinger Band is below the 50 day moving average and rising which is bullish. The Upper Bollinger Band is falling which is bearish and could be signaling a Bollinger Bands Squeeze is coming next week.
The SPX chart has more bearish signals for Friday. Any bounce is an opportunity to take further profits.
SPX Stock Market Outlook review of Thu Nov 13 2025
Stock Market Outlook: Technical Indicators Review
Momentum: Momentum is falling and negative.
|
MACD Histogram: MACD (Moving Averages Convergence / Divergence) issued a down signal on Wed Nov 5. On Thu Nov 13 2025 the down signal that was almost gone has recovered and is strongly negative.
|
Ultimate Oscillator: The Ultimate Oscillator is falling.
|
Slow Stochastic: The Slow Stochastic has a sharp down signal.
|
Relative Strength Index: The RSI signal is falling sharply.
|
| Rate of Change: The rate of change is falling, signaling Friday will end lower. Settings: Rate Of Change is set for a 21 period. This indicator looks back 21 days and compares price action from the past to the present. With the Rate Of Change, prices are rising when signals are positive. Conversely, prices are falling when signals are negative. As an advance rises, the Rate Of Change signal should also rise higher, otherwise the rally is suspect. A decline should see the Rate Of Change fall into negative signals. The more negative the signals the stronger the decline. |
Stock Market Outlook: Support and Resistance Levels |
| 6900 is resistance |
| 6875 is resistance |
| 6850 is resistance |
| 6800 is resistance |
| 6775 is resistance |
| 6750 is resistance |
| 6715 is resistance |
| 6700 is resistance |
| 6675 is resistance |
| 6650 is resistance |
| 6625 is resistance |
| 6600 is support |
| 6590 is support |
| 6570 is support |
| 6550 is support |
| 6500 is support |
| 6450 is support |
| 6425 is support |
| 6400 is support |
Stock Market Outlook for Fri Nov 14 2025
For Fri Nov 14 2025 the index could easily attempt a bounce. The technical signals though are advising that any bounce won’t hold and even if Friday closes higher, the start of next week will be lower.
For Friday take profits on bounces and hold capital aside in case stocks fall below the 50 day and setup the SPX to test the 100 day moving average. Stocks need to build support if they are to push higher. Much of that support will come if the Fed cuts interest rates again in December. As well, if the Supreme Court rules that the tariffs are legal, stocks will move higher. For Friday stay cautious and keep capital at the ready but wait for clear up signals which could be as early as next week.
Potential Economic and Political Market Moving Events
Monday:
No reports to be released
Tuesday:
6:00 NFIB optimism index slipped to 98.2 from 98.8
Wednesday:
Fed officials are at various speaking engagements today from 9:20 to 4:00 PM. This could add a bit of choppiness to Wednesday’s trading but most investors expect a rate cut in December and not much from Fed officials will change that outlook at present.
Thursday.
Consumer Price Index was to be reported today but with the government shutdown reports are not expected.
Friday:
Retails sales and Producer Price Index reports were to be released but will remain on hold today due to the government shutdown. We should start receiving economic data again as early as next week with the government shut down ended.