

Once again on Thursday sellers pushed back at buyers despite a strong opening. Two early morning spikes were sold off and the index eventually ended up back at the 4200 valuation. By the close the S&P was up just 4 points to close at 4200.
But volumes are increasing which may signal that the bulls are battling through sellers to move higher.
Stock Market Outlook Chart Comments At The Close on Thu May 27 2021
The Bollinger Bands are showing some signs of losing their bullishness. The Lower Bollinger Band is below the 50 day moving average which is a bullish signal. The Upper Bollinger Band though, is not rising but moving sideways which is bearish. The Upper Bollinger Band needs to move higher. The fact that it continues to move sideways signals there is weakness to the current advance.
The S&P stayed above the 21 day moving average and ended above it for the fourth day. This left behind a bullish candlestick for Friday.
The 21 day moving average is back climbing and the 50, 100 and 200 day moving averages are also still climbing.
The chart is still mixed but the close above the 21 day moving average for a fourth day is bullish.
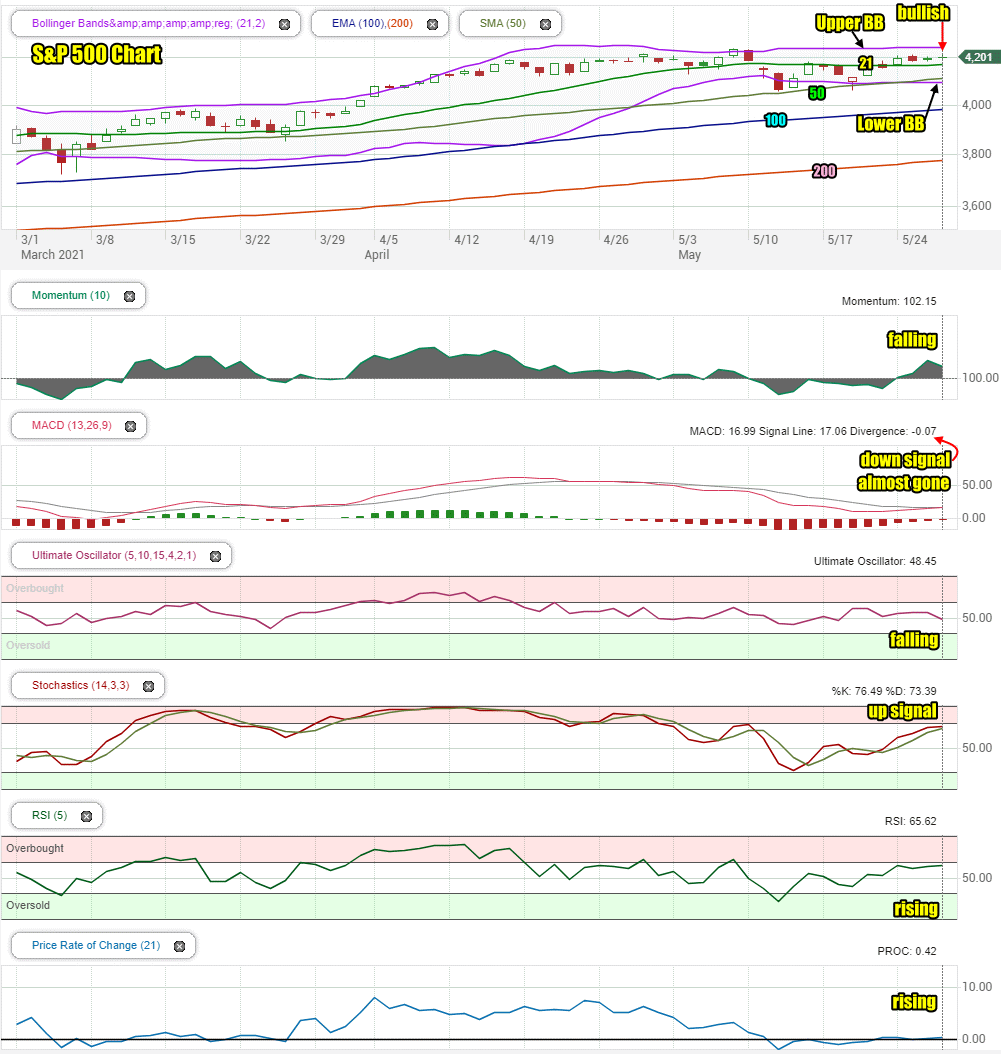
Stock Market Outlook review of Thu May 27 2021
Stock Market Outlook: Technical Indicators Review:
Momentum: Momentum is fallingg and positive.
- Settings: For momentum I use a 10 period when studying market direction.
MACD Histogram: MACD (Moving Averages Convergence / Divergence) issued a down signal on Friday April 30 2021. On Thursday the down signal is almost gone with a reading of minus 0.07 which is basically neutral.
- Settings: For MACD Histogram, I am using the Fast Points set at 13, Slow Points at 26 and Smoothing at 9.
Ultimate Oscillator: The Ultimate Oscillator is falling.
- Settings: The Ultimate Oscillator settings are: Period 1 is 5, Period 2 is 10, Period 3 is 15, Factor 1 is 4, Factor 2 is 2 and Factor 3 is 1. These are not the default settings but are the settings I use with the S&P 500 chart set for 1 to 3 months.
Slow Stochastic: The Slow Stochastic has an up signal in place for Friday but the signal is weakening.
Settings: For the Slow Stochastic I use the K period of 14 and D period of 3. The Slow Stochastic tries to predict the market direction further out than just one day.
Relative Strength Index: The RSI signal is rising.
- Settings: The relative strength index is set for a period of 5 which gives it 5 days of market movement to monitor. It is often the first indicator to show an overbought or oversold signal.
Rate of Change: The rate of change signal is rising indicating higher prices are ahead.
- Settings: Rate Of Change is set for a 21 period. This indicator looks back 21 days and compares price action from the past to the present. With the Rate Of Change, prices are rising when signals are positive. Conversely, prices are falling when signals are negative. As an advance rises the Rate Of Change signal should also rise higher, otherwise the rally is suspect. A decline should see the Rate Of Change fall into negative signals. The more negative the signals the stronger the decline.
Support and Resistance Levels To Be Aware Of:
4250 is resistance
4225 is resistance
4200 is resistance
4150 is light support
4100 is light support
4070 is very light support
4050 is light support and where the 50 day is currently residing. This would represent a 4.4% decline.
4000 is good support
3900 is support and just below the 100 day moving average.
3850 is support
3800 is support
3750 is good support
3700 is light support and just below the 200 day moving average.
3680 is light support
3600 is strong support
Stock Market Outlook for Tomorrow – Fri May 28 2021
For Friday there are a few subtle changes in the technical indicator tools.
The Slow Stochastic is showing weakness is starting to build despite still having an up signal. MACD on the other hand is pretty well neutral having lost the down signal.
The Relative Strength Index (RSI) is still rising which is a good sign and the Rate Of Change is advising that prices may be higher again on Friday.
Volume rose in both New York and the NASDAQ indexes and buyers are pushing sellers as they try to move the market higher.
Overall the outlook is still the same. Weakness with dips has to be expected but the close should again be higher on Friday.
Stock Market Outlook Archives
Stock Market Outlook For Thu May 7 2026 – Bullish and Still Higher

Morning Investing Strategy Notes for Wed May 6 2026

Stock Market Outlook For Wed May 6 2026 – Choppy But Higher Still

Morning Investing Strategy Notes for Tue May 5 2026
Stock Market Outlook For Tue May 5 2026 – Overbought and Lower

Morning Investing Strategy Notes for Mon May 4 2026
Stock Market Outlook For Mon May 4 2026 – Dips Likely With Possible Lower Close

Morning Investing Strategy Notes for Fri May 1 2026
Stock Market Outlook For Fri May 1 2026 – Overbought But Higher
Morning Investing Strategy Notes for Thu Apr 30 2026
Stock Market Outlook For Thu Apr 30 2026 – Dips Likely Possible Lower Close
Morning Investing Strategy Notes for Wed Apr 29 2026