
 Prior Trading Day Summary:
On Thu May 1 2025 The SPX jumped at the open as expected. Strong results from Microsoft Stock (MSFT) and Meta Stock (META) helped entice stocks higher. A drop in the last 10 minutes of the day as obviously a large number of trades took place, sliced the rally from 5640 down to a close of 5604 for a dramatic 36 point drop. Despite this selling, the SPX closed up 35 points to 5604 wiping out yesterday’s loss. For the week, the SPX is now up 35 points. Without the late day selling the stats were more strongly bullish but the final 10 minutes massive selling, meant that only 50% of al volume was traded higher and only 54% of stocks were higher.
The NASDAQ closed up 264 points to end the day at 17710. For the week the NASDAQ is up 181 points. Volume on the NASDAQ was 8.7 billion with 59% of the volume rising and 53% of all stocks higher by the close.
On Thursday after the close we got earnings from a number of companies but paramount was Apple and Amazon. Both beat estimates but Apple shares fell almost 4% and Amazon fell 3.2%. This could reverse itself Friday morning however investors also get the April non-farm payroll numbers at 8:30 on Friday which many economists are now predicting will be poor and could send stocks lower. Friday is shaping up to be a volatile day.
Let’s review the technical indicators from the close on Thu May 1 2025 to see what we should expect for Fri May 2 2025.
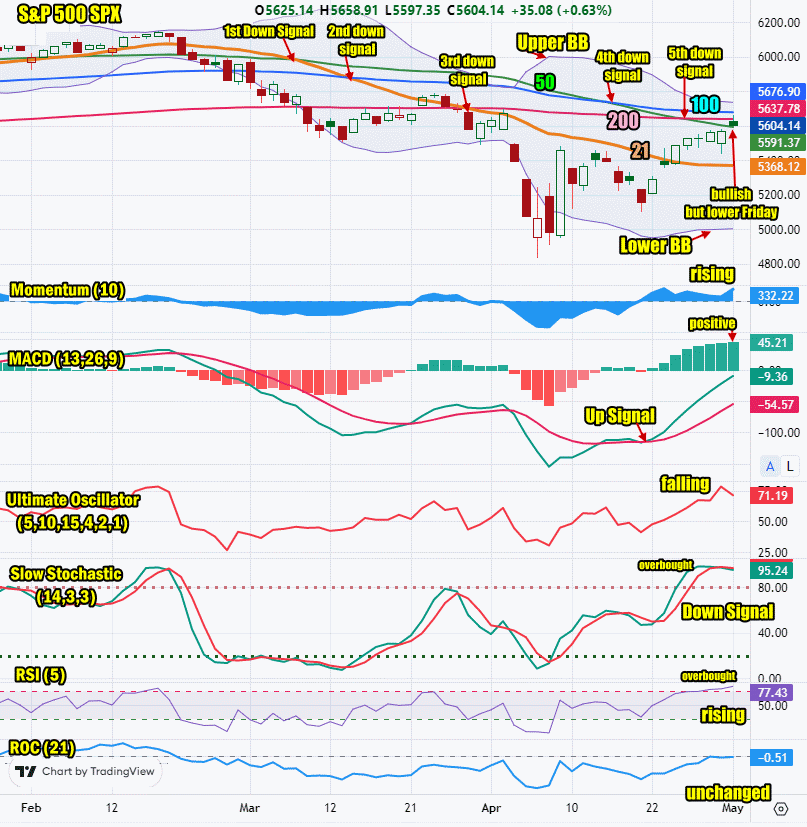
Stock Market Outlook: SPX Closing Chart For Thu May 1 2025
The index closed above the 50 day, 21 day and reached 200 day moving average and closed just below it. This is bullish.
The closing candlestick is bullish but the long shadow signals a probable lower close on Friday. This does not signal any end to the rally.
The 21 day moving average is falling and closed at 5368. The 21 day moving average fell below the 50 day on Friday Mar 7. It fell below the 100 day on Thursday Mar 13 for a second down signal and on Friday Mar 28 it fell below the 200 day for a third down signal. Note that the 21 day decline is slowing. This is a sign the downtrend could be ending.
The 50 day moving average is falling and closed at 5591 which is bearish. The 50 day moving average fell below the 100 day on Tue April 15. which issued a 4th down signal on the SPX. The 50 day on Friday fell below the 200 day for a 5th down signal.
The 100 day moving average is falling and closed at 5676 which is bearish.
The 200 day moving average is almost unchanged and closed at 5637 which is bearish. The decline in the 200 day is stalled.
All of the moving averages are either continuing their decline or stalled, but two continue to indicate we could see the sell-off end shortly.
The Lower Bollinger Band is turning sideways which is bearish to neutral. The Upper Bollinger Band is also turning sideways. This could be a signal the market could become range bound for a few days. We will know more Friday.
For Friday the SPX chart is still bearish but there are more bullish signs developing. A lot will depend on Friday’s jobs numbers.
SPX Stock Market Outlook review of Thu May 1 2025
Stock Market Outlook: Technical Indicators Review
Momentum: Momentum is rising and positive.
|
MACD Histogram: MACD (Moving Averages Convergence / Divergence) issued an up signal on Tue Apr 22 2025. On Thu May 1 2025 the up signal was stronger.
|
Ultimate Oscillator: The Ultimate Oscillator is falling sharply and positive.
|
Slow Stochastic: The Slow Stochastic is overbought and has a down signal at the close on Thursday.
|
Relative Strength Index: The RSI signal is rising and overbought.
|
| Rate of Change: The rate of change signal is neutral indicating not much change is expected for Friday. Settings: Rate Of Change is set for a 21 period. This indicator looks back 21 days and compares price action from the past to the present. With the Rate Of Change, prices are rising when signals are positive. Conversely, prices are falling when signals are negative. As an advance rises, the Rate Of Change signal should also rise higher, otherwise the rally is suspect. A decline should see the Rate Of Change fall into negative signals. The more negative the signals the stronger the decline. |
Stock Market Outlook: Support and Resistance Levels |
| 5700 is resistance |
| 5650 is resistance |
| 5630 is resistance |
| 5600 is resistance |
| 5550 is resistance |
| 5500 is resistance |
| 5450 is resistance |
| 5400 is resistance |
| 5350 is support |
| 5300 is support |
| 5230 is support |
| 5000 is support |
| 4770 is support |
| 4680 is support |
| 4500 is support |
| 4365 is support |
| 4150 is support |
| 4000 is support |
Stock Market Outlook for Fri May 2 2025
For Friday the April jobs numbers will have the most impact to start the day. Analysts are anticipating a surprise to the downside and a rise in the unemployment rate. This could weigh on the indexes. Meanwhile earnings from Apple and Amazon, seemed to hurt the market after hours on Thursday. That though could change on Friday when stocks begin trading.
For Friday the technical indicators are a bit mixed but most remain bullish and point to a higher day. It will though be choppy and could at times be volatile.
Potential Economic and Political Market Moving Events
Monday:
No reports
Tuesday:
8:30 Advanced trade balance in goods surprised analysts with a jump to $162.0 billion.
8:30 Advanced retail inventories were unchanged at -0.1%
8:30 Advanced wholesale inventories were unchanged at 0.5%
9:00 S&P Case-Shiller home price index was lower than estimated, at 4.5%
10:00 Consumer confidence slipped to 86 from 93.9
10:00 Job openings fell to 7.2 million from 7.5 million prior
Wedneday:
8:15 ADP employment numbers fell to just 62,000 from 124,000 prior
8:30 GDP plunged to 0.3% annualized from 2.4% prior
8:30 Personal income was higher at 0.5% than estimated but below 0.8% prior
8:30 Employment cost index was unchanged at 0.9%
9:45 Chicago Business Barometer (PMI) dropped further than estimated to 44.6 from 47.6 prior
10:00 Consumer spending is rose more than expected to 0.7% from 0.4% prior
10:00 Personal Consumption Expenditures (PCE) index dropped to 0.0% from 0.3% prior
10:00 PCE year-over-year dropped to 2.3% from 2.5% prior
10:00 Core PCE index dropped to 0.0% from 0.4% prior
10:00 Core PCE year-over-year fell to 2.6% from 2.8% prior
10:00 Pending home sales jumped 6.1% from 2.1% prior
Most of the economic reports on Wednesday point to continued weakness or growing weakness.
Thursday:
8:30 Weekly Initial Unemployment Insurance Claims rose to 241,000 which many analysts indicated points to continued weakness in the economy
9:45 S&P final manufacturing PMI slipped lower than estimated, to 50.2 from 50.7 prior
10:00 ISM manufacturing is rose more than estimated to 48.7% but still below the 49% prior
10:00 Construction spending plunged to -0.5%
Intraday Auto sales rose to 17.2 million, higher by 200,000 vehicles than estimated
Friday:
8:30 April non-farm payroll is estimated at 133,000
8:30 Unemployment rate is estimated to rise to 4.3%
8:30 Hourly wages are estimated to remain unchanged at 0.3%
8:30 Hourly wages year-over-year are estimated to rise to 3.9% from 3.8%
10:00 Factory orders are estimated to jump to 4.3% from 0.6% due to companies increasing orders ahead of tariffs being implemented on a wide range of products