FullyInformed.com
Generic filters
Exact matches only
Search in title
Search in content
Search in excerpt

Stock Market Outlook for Fri May 15 2020 – Confirmed Down But Sideways To Start

May 14, 2020 | Stock Market Outlook

Stock Market Outlook Sideways

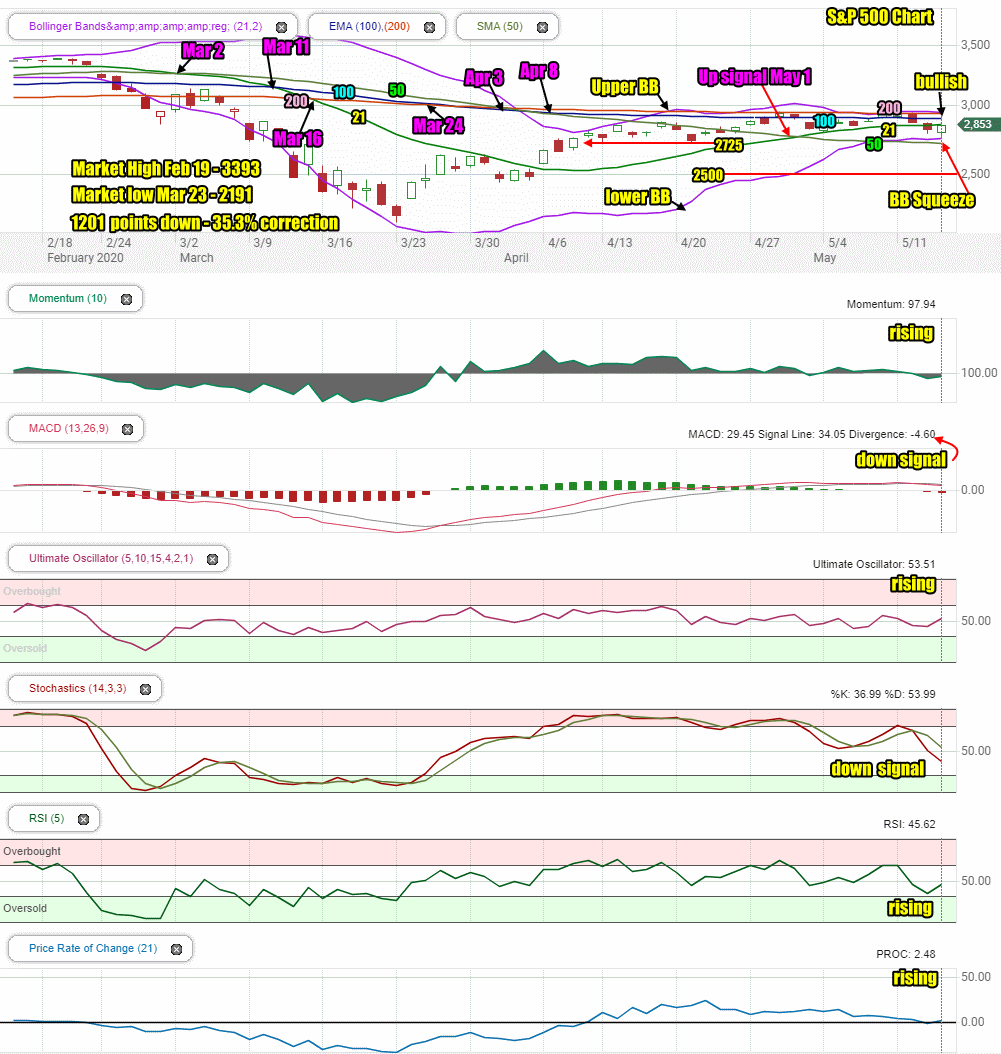
Thursday saw stocks fall at the open of trading and then stage a number of rallies including a late day rally to close at the highs of the day. The index fell below 2800 reaching 2794, the lowest level since April 24. That brought in buyers. By the close the index was back to 2852 but still below the 21 day, 100 and 200 day moving averages. The index was however still inside the Bollinger Bands Squeeze which is often a bullish signal.

Part of the drop in the morning was caused by the release of the Weekly Initial Unemployment Insurance Claims which showed around 3 million more claims for the week which brings the total to around 36.5 million unemployed, a staggering number. The afternoon though, got a boost from MasterCard which indicated they were noticing an upturn in the number of credit card charges which indicates consumers are starting to buy again.

Let’s look at Thursday close to see what the technical indicators are advising for Friday.


Stock Market Outlook Chart Comments At The Close on Thu May 14 2020 

The SPX chart continues to be bearish with 6 sell signals in the chart and a Bollinger Bands Squeeze that is still underway. There is one up signal from May 1 with the 21 day moving average, back above the 50 day.

The closing candlestick was bullish for Friday. The index closed below the 200, 100 and 21 day moving averages. It closed back inside the Bollinger Bands Squeeze.

The 200 day moving average is still leading the market, which is typical in a bear market. It is still followed closely by the 100 day. The 100 day is continuing to not fall further but is trending sideways with the 200 day. Normally this is somewhat bullish. The 50 day is continuing to fall while the 21 day is moving higher but is turning sideways and does not look like it will climb much further at present.

The Bollinger Bands Squeeze is underway and is showing signs the index may move lower out of the squeeze. The Lower Bollinger Band is above the 50 day and the Upper Bollinger Band is at the 200 day, both of which are normally bullish in a rally. While the chart is still bearish there are growing signs that the lows of March may not be revisited unless a new catalyst to the downside should appear.

Stock Market Outlook review of Thu May 14 2020

Stock Market Outlook: Technical Indicators Review:

Momentum: Momentum is rising but still negative.

  • Settings: For momentum I use a 10 period when studying market direction.

MACD Histogram: MACD (Moving Averages Convergence / Divergence) issued an unconfirmed down signal on Wed May 13 2020. The down signal was confirmed on Thursday.

  • Settings: For MACD Histogram, I am using the Fast Points set at 13, Slow Points at 26 and Smoothing at 9. 

Ultimate Oscillator: The Ultimate Oscillator signal is rising and back positive.

  • Settings: The Ultimate Oscillator settings are: Period 1 is 5, Period 2 is 10, Period 3 is 15, Factor 1 is 4, Factor 2 is 2 and Factor 3 is 1. These are not the default settings but are the settings I use with the S&P 500 chart set for 1 to 3 months.

Slow Stochastic: The Slow Stochastic has a strong down signal in place.

Settings: For the Slow Stochastic I use the K period of 14 and D period of 3. The Slow Stochastic tries to predict the market direction further out than just one day.

Relative Strength Index: The RSI signal is rising.

  • Settings: The relative strength index is set for a period of 5 which gives it 5 days of market movement to monitor.  It is often the first indicator to show an overbought or oversold signal.

Rate of Change: The rate of change signal is trying to rise.

  • Settings: Rate Of Change is set for a 21 period. This indicator looks back 21 days and compares price action from the past to the present. With the Rate Of Change, prices are rising when signals are positive. Conversely, prices are falling when signals are negative. As an advance rises the Rate Of Change signal should also rise higher, otherwise the rally is suspect. A decline should see the Rate Of Change fall into negative signals. The more negative the signals the stronger the decline.


Support and Resistance Levels To Be Aware Of:

3000 is strong resistance

2950 is resistance

2900 is resistance

2860 is light support

2840 is light support

2800 is good support

2725 is light support

2700 is light support and marked a drop of 20.4%.

2675 is light resistant

2650 is light support

2625 is light support

2600 is support

2550 is light support

2500 was good support and marked a correction of 26.3%

2344 is the next level of support and marks a 30.9% correction.

2191 was the market low on March 23 and most analysts believe this is the low point we will see.

2100 is light support

2000 is good support and marks a drop of 1393 points for a 41% correction. Some analysts believe the index will fall this low before the bear market ends.


 Stock Market Outlook for Tomorrow – Fri May 15 2020 

At the close of trading on Thursday the MACD down signal was confirmed. This would direct investors to stay cautious that the rally we saw on Wednesday afternoon, is just a bounce. The 2800 level was tested once more on Thursday and held the market up. From here however, the index is back pushing through overbought signals and stocks that are overpriced.  At the same time, the rally back on Thursday afternoon shows that buyers are ready and willing to jump into stocks on signals that the economy may improve quicker than originally thought. Just a bit of positive news from MasterCard was enough to jump buyers back into stocks and end the day positive.

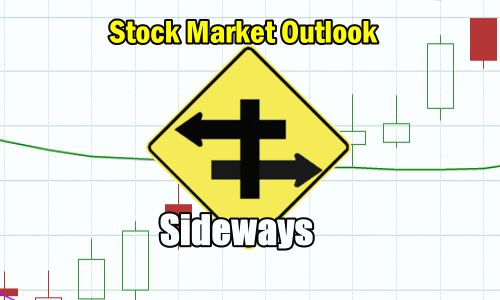
For Friday, stocks look set to try again to move higher but it won’t take much to bring back sellers. That means the sideways trend is continuing to stay with stocks at present.

Friday should see a flat or sideways move in the index, to end higher by the close of trading.

The MACD sell signal could disappear quickly if the index moves higher over the next several trading days. Otherwise the signal will be right and stocks will pullback. For Friday we should see a sideways pattern with a bias higher to start but the sell signal could come into play by early next week. We should know more by the close on Friday.


Stock Market Outlook Archives

Stock Market Outlook For Wed May 6 2026 – Choppy But Higher Still

Stock Market Outlook - Still Higher
Prior Trading Day Summary On Tuesday stocks again shook off Middle East worries and climbed higher. The SPX made another new intraday high as it reached 7273. The index closed ....... Read More

Morning Investing Strategy Notes for Tue May 5 2026

Morning Investing Strategy Notes
For FullyInformed Members the morning Investing Strategy Notes for Tue May 5 2026 look at the dip on Monday and the chance for another lower close today. There are a ....... Read More

Stock Market Outlook For Tue May 5 2026 – Overbought and Lower

Stock Market Outlook For Tue May 5 2026 - Overbought and Lower
Prior Trading Day Summary On Monday stocks saw some minor pressure and ended the day slightly lower. The SPX lost 29 points to close at 7200 on 5.2 billion shares ....... Read More

Morning Investing Strategy Notes for Mon May 4 2026

Morning Investing Strategy Notes
For FullyInformed Members the morning Investing Strategy Notes for Mon May 4 2026 look at the chance for a lower close. There are a large number of equities discussed in ....... Read More

Stock Market Outlook For Mon May 4 2026 – Dips Likely With Possible Lower Close

Stock Market Outlook - Dips Likely - Lower CLose
Prior Trading Day Summary On Friday stocks continued to push higher on the back of better than estimated earnings from a number of large cap companies. With their stocks continuing ....... Read More

Morning Investing Strategy Notes for Fri May 1 2026

Morning Investing Strategy Notes
For FullyInformed Members the morning Investing Strategy Notes for Fri May 1 2026 look at the chance for another closing new high on Friday. There are a large number of ....... Read More

Stock Market Outlook For Fri May 1 2026 – Overbought But Higher

Stock Market Outlook - still higher
Prior Trading Day Summary On Thursday earnings from a number of big cap stocks like Alphabet Stock (GOOGL) and Eli Lilly Stock (LLY) helped to push the indexes to new ....... Read More

Morning Investing Strategy Notes for Thu Apr 30 2026

Morning Investing Strategy Notes
For FullyInformed Members the morning Investing Strategy Notes for Thu Apr 30 2026 look at the odds of a lower day. There are a large number of equities discussed in ....... Read More

Stock Market Outlook For Thu Apr 30 2026 – Dips Likely Possible Lower Close

Stock Market Outlook - Dips Likely - Lower CLose
Prior Trading Day Summary On Wednesday the SPX closed slightly lower while the NASDAQ closed higher ending the day with a mixed outlook. The SPX fell 3 points to close ....... Read More

Morning Investing Strategy Notes for Wed Apr 29 2026

Morning Investing Strategy Notes
For FullyInformed Members the morning Investing Strategy Notes for Wed Apr 29 2026 look at expectations for profits on Wednesday and especially Thursday. There are a large number of equities ....... Read More

Stock Market Outlook For Wed Apr 29 2026 – Choppy But Higher Ahead Of More Earnings

Stock Market Outlook Choppy Dips Higher
Prior Trading Day Summary On Tuesday both the SPX and NASDAQ lost a little ground but the bigger earnings are set to be released starting tomorrow. The SPX fell 35 ....... Read More

Morning Investing Strategy Notes for Tue Apr 28 2026

Morning Investing Strategy Notes
For FullyInformed Members the morning Investing Strategy Notes for Tue Apr 28 2026 look at anticipated market action for today. There are a number of equities discussed in today's morning ....... Read More

Recent Outlooks

Stock Market Outlook For Thu May 7 2026 – Bullish and Still Higher

Prior Trading Day Summary On Wednesday stocks soared as strong earnings from Advanced Micro Devices Stock (AMD) sparked another rally. The SPX made another new intraday high as it reached 7369. The index closed up 106 points to end the …

Morning Investing Strategy Notes for Wed May 6 2026

For FullyInformed Members the morning Investing Strategy Notes for Wed May 6 2026 look at the rebound on Tuesday following Monday’s selling.. There are a large number of equities discussed in today’s morning Investing Strategy Notes. They include Palantir Tech …

Stock Market Outlook For Wed May 6 2026 – Choppy But Higher Still

Prior Trading Day Summary On Tuesday stocks again shook off Middle East worries and climbed higher. The SPX made another new intraday high as it reached 7273. The index closed up 58 points to end the day at 7259 on …

Morning Investing Strategy Notes for Tue May 5 2026

For FullyInformed Members the morning Investing Strategy Notes for Tue May 5 2026 look at the dip on Monday and the chance for another lower close today. There are a large number of equities discussed in today’s morning Investing Strategy …

Stock Market Outlook For Tue May 5 2026 – Overbought and Lower

Prior Trading Day Summary On Monday stocks saw some minor pressure and ended the day slightly lower. The SPX lost 29 points to close at 7200 on 5.2 billion shares traded. 63% of all stocks were falling by the close …

Morning Investing Strategy Notes for Mon May 4 2026

For FullyInformed Members the morning Investing Strategy Notes for Mon May 4 2026 look at the chance for a lower close. There are a large number of equities discussed in today’s morning Investing Strategy Notes. They include Palantir Tech Stock …

Stock Market Outlook For Mon May 4 2026 – Dips Likely With Possible Lower Close

Prior Trading Day Summary On Friday stocks continued to push higher on the back of better than estimated earnings from a number of large cap companies. With their stocks continuing to climb, stocks are once more extremely overbought. The SPX …

Morning Investing Strategy Notes for Fri May 1 2026

For FullyInformed Members the morning Investing Strategy Notes for Fri May 1 2026 look at the chance for another closing new high on Friday. There are a large number of equities discussed in today’s morning Investing Strategy Notes. They include …

Stock Market Outlook For Fri May 1 2026 – Overbought But Higher

Prior Trading Day Summary On Thursday earnings from a number of big cap stocks like Alphabet Stock (GOOGL) and Eli Lilly Stock (LLY) helped to push the indexes to new all-time highs yet again. The SPX rose 73 points to …

Morning Investing Strategy Notes for Thu Apr 30 2026

For FullyInformed Members the morning Investing Strategy Notes for Thu Apr 30 2026 look at the odds of a lower day. There are a large number of equities discussed in today’s morning Investing Strategy Notes. They include Alphabet Stock (GOOGL), …

Stock Market Outlook For Thu Apr 30 2026 – Dips Likely Possible Lower Close

Prior Trading Day Summary On Wednesday the SPX closed slightly lower while the NASDAQ closed higher ending the day with a mixed outlook. The SPX fell 3 points to close at 7135 on 5.2 billion shares traded. Just 37% of …

Morning Investing Strategy Notes for Wed Apr 29 2026

For FullyInformed Members the morning Investing Strategy Notes for Wed Apr 29 2026 look at expectations for profits on Wednesday and especially Thursday. There are a large number of equities discussed in today’s morning Investing Strategy Notes. They include Nucor …

Stock Market Outlook For Wed Apr 29 2026 – Choppy But Higher Ahead Of More Earnings

Prior Trading Day Summary On Tuesday both the SPX and NASDAQ lost a little ground but the bigger earnings are set to be released starting tomorrow. The SPX fell 35 points to close at 7178 on 5 billion shares traded …

Morning Investing Strategy Notes for Tue Apr 28 2026

For FullyInformed Members the morning Investing Strategy Notes for Tue Apr 28 2026 look at anticipated market action for today. There are a number of equities discussed in today’s morning Investing Strategy Notes. They include Intel Stock (INTC), Nucor Stock …

Subscribe For The Latest News