
Thursday March 10 started the day weakly with the S&P falling to 4210 but on low volume. That brought in buyers who by the close, had pushed the S&P above the morning open. The day ended with a slight loss of 18 points and a close at 4259.
The NASDAQ closed down 125 points to 13,129. The important signal from Thursday’s market was that the gains made on Wednesday were not given back and in the case of the S&P, they were hardly touched at all. This bodes well for Friday.
Let’s review the closing technical indicators from Thursday on the SPX to see what they show for Friday’s trading.
Stock Market Outlook Chart Comments At The Close on Thu Mar 10 2022
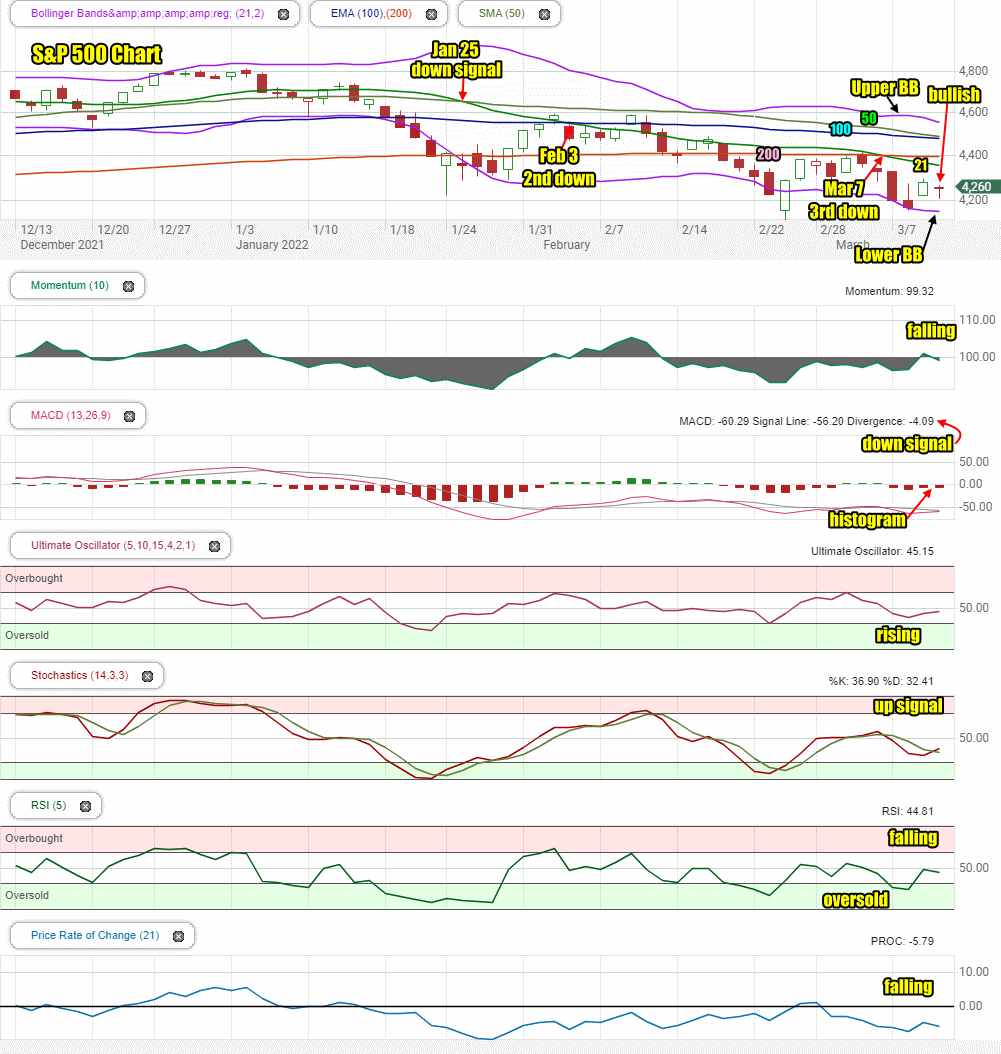
There are some changes in the S&P chart following Thursday’s close.
The Upper Bollinger Band is turning lower while the Lower Bollinger Band is turning sideways. This is a mixed signal advising that investors are not sure they want to take stocks much lower. If the Lower Bollinger Band begins to fall then we know the market will move lower. If though it rises to meet the Upper Bollinger Band there is a good case for the market to change back to higher. We will know more next week.
The closing candlestick on Thursday is important. It is signaling a chance the trend down will change. It may change to sideways for a couple of days but then move higher. A lot depends on all the geopolitical events, inflation and of course oil prices. These are presently weighing on investors which is keeping the market down.
There are now 3 down signals in place which you can see in the chart below. The 50 day moving average is still falling and ready to move below the 100 day which will be a fourth down signal.
All the major moving averages are falling lower with the 200 day still holding the 4400 level.
The chart remains very negative as of Thursday’s close but with a chance for a trend change to start off next week. Even a change to sideways would be an improvement for a few days.
Stock Market Outlook review of Wed Mar 9 2022
Stock Market Outlook: Technical Indicators Review:
Momentum: Momentum is falling and back negative.
- Settings: For momentum I use a 10 period when studying market direction.
MACD Histogram: MACD (Moving Averages Convergence / Divergence) issued a down signal on Mon Mar 7 2022 . The down signaled weakened on Thursday. The MACD histogram shows a further weakening as well.
- Settings: For MACD Histogram, I am using the Fast Points set at 13, Slow Points at 26 and Smoothing at 9.
Ultimate Oscillator: The Ultimate Oscillator is negative and rising.
- Settings: The Ultimate Oscillator settings are: Period 1 is 5, Period 2 is 10, Period 3 is 15, Factor 1 is 4, Factor 2 is 2 and Factor 3 is 1. These are not the default settings but are the settings I use with the S&P 500 chart set for 1 to 3 months.
Slow Stochastic: The Slow Stochastic still has an up signal in place.
Settings: For the Slow Stochastic I use the K period of 14 and D period of 3. The Slow Stochastic tries to predict the market direction further out than just one day.
Relative Strength Index: The RSI signal is falling.
- Settings: The relative strength index is set for a period of 5 which gives it 5 days of market movement to monitor. It is often the first indicator to show an overbought or oversold signal.
Rate of Change: The rate of change signal is falling.
- Settings: Rate Of Change is set for a 21 period. This indicator looks back 21 days and compares price action from the past to the present. With the Rate Of Change, prices are rising when signals are positive. Conversely, prices are falling when signals are negative. As an advance rises the Rate Of Change signal should also rise higher, otherwise the rally is suspect. A decline should see the Rate Of Change fall into negative signals. The more negative the signals the stronger the decline.
Support and Resistance Levels To Be Aware Of:
4500 is resistance
4490 is light resistance
4475 is light resistance
4450 is light resistance
4400 is good support and the 200 day moving average
4370 is light support
4350 is light support
4300 is good support
4290 is light support
4270 is light support
4250 is good support
4225 is light support
4200 is good support
4150 is good support
4000 is good support
Stock Market Outlook for Tomorrow – Fri Mar 11 2022
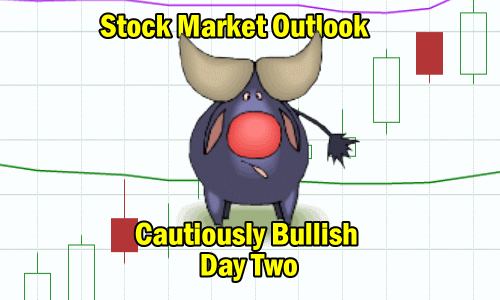
The closing candlestick on Thursday may end up being the key to the day’s action. It is not overly bearish or bullish but instead is advising the market could move either way but a big move up or down is not expected. The outlook remains cautiously bullish for a second day. That means even a small loss such as we saw on Thursday is still bullish as it tells us that buyers are stepping back in. On the other side of the picture are the put buyers who are loading up on put options on the S&P and a variety of ETFs such as those for Russia and emerging markets in general. They are of the opinion there is much more downside to come. They could be right but Tuesday’s, Wednesday’s and today’s recovery from the morning lows, are signs that investors are ready to buy stocks and think at present levels many are undervalued. We could see more of this on Friday which is why the outlook remains cautiously bullish.
Longer term though the markets remains in a downtrend and there is no change in that. This jump is a technical bounce in what is at present a longer term downtrend. The longer the war continues and the sanctions stay on, the more chance there is of recession. On Friday if there is a jump, I will be buying SPY put options again.
Stock Market Outlook Archives
Stock Market Outlook For Wed May 6 2026 – Choppy But Higher Still

Morning Investing Strategy Notes for Tue May 5 2026

Stock Market Outlook For Tue May 5 2026 – Overbought and Lower

Morning Investing Strategy Notes for Mon May 4 2026
Stock Market Outlook For Mon May 4 2026 – Dips Likely With Possible Lower Close

Morning Investing Strategy Notes for Fri May 1 2026
Stock Market Outlook For Fri May 1 2026 – Overbought But Higher

Morning Investing Strategy Notes for Thu Apr 30 2026
Stock Market Outlook For Thu Apr 30 2026 – Dips Likely Possible Lower Close
Morning Investing Strategy Notes for Wed Apr 29 2026
Stock Market Outlook For Wed Apr 29 2026 – Choppy But Higher Ahead Of More Earnings

Morning Investing Strategy Notes for Tue Apr 28 2026