

Thursday saw the index open higher and then dip back. The dip after 11:00 AM fell slightly below 2920 but on low volume. The lack of selling brought in buyers who pushed the index to 2929 by 1:30. The final hour of trading saw the index slip and end the day at 2925 but still up on the day.
Stock Market Outlook Chart Comments At The Close on Thu Jun 27 2019
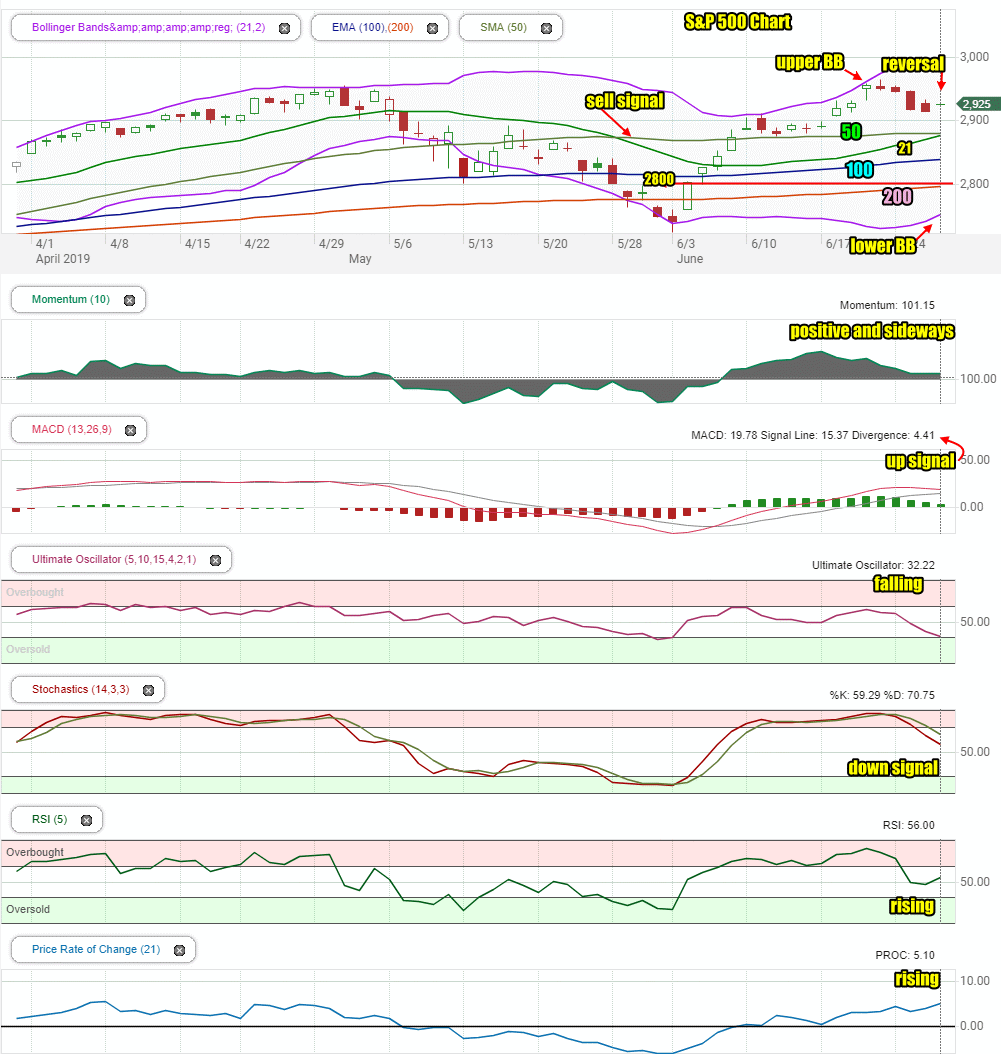
The index closed below the Upper Bollinger Band but above the 50 day moving average. The closing candlestick is often a reversal. We should know more on Friday or Monday next week.
The Lower Bollinger Band is rising which usually indicates a move higher is coming shortly.
There is still one sell signal in play but the 21 day is now at the 50 day. Once it crosses over it, which should happen tomorrow, it will be a buy signal and negate the earlier sell signal.
All the moving averages are climbing and the 200 day is almost ready to cross above the 2800 level which will also be bullish.
Stock Market Outlook review of Thu Jun 27 2019
Stock Market Outlook: Technical Indicators Review:
Momentum: Momentum is positive and moving sideways. Friday should be higher for momentum.
- Settings: For momentum I use a 10 period when studying market direction.
MACD Histogram: MACD (Moving Averages Convergence / Divergence) issued an up signal on Thursday June 6. The up signal was weaker again on Thursday.
- Settings: For MACD Histogram, I am using the Fast Points set at 13, Slow Points at 26 and Smoothing at 9.
Ultimate Oscillator: The Ultimate Oscillator signal is negative and falling nearing oversold readings.
- Settings: The Ultimate Oscillator settings are: Period 1 is 5, Period 2 is 10, Period 3 is 15, Factor 1 is 4, Factor 2 is 2 and Factor 3 is 1. These are not the default settings but are the settings I use with the S&P 500 chart set for 1 to 3 months.
Slow Stochastic: The Slow Stochastic signal has a down signal in place. There is no longer an overbought signal.
- Settings: For the Slow Stochastic I use the K period of 14 and D period of 3. The Slow Stochastic tries to predict the market direction further out than just one day.
Relative Strength Index: The RSI signal is rising.
- Settings: The relative strength index is set for a period of 5 which gives it 5 days of market movement to monitor. It is often the first indicator to show an overbought or oversold signal.
Rate of Change: The rate of change signal is also rising.
- Settings: Rate Of Change is set for a 21 period. This indicator looks back 21 days and compares price action from the past to the present. With the Rate Of Change, prices are rising when signals are positive. Conversely, prices are falling when signals are negative. As an advance rises the Rate Of Change signal should also rise higher, otherwise the rally is suspect. A decline should see the Rate Of Change fall into negative signals. The more negative the signals the stronger the decline.
Support Resistance Levels To Be Aware Of:
2950 is resistance
2900 is light support
2860 is better support
2830 is light support
2800 is strong support
2795 is light support
2745 to 2750 is light support
2725 is light support
2700 is light support
2675 is light support
2650 is support
2625 is light support
2600 is support.
There was good support at the 2550 level which is back to being support.
The 2500 level is support.
The S&P has light support at 2480 and better support at 2450.
There is good support at 2425.
Below that there is some support at 2400, 2380, 2350.
Stock Market Outlook for Tomorrow – Fri Jun 28 2019
For Friday the S&P looks more positive aside from MACD which continues to weaken. That indicator would be the biggest concern.
For Friday, rumours of potential Chinese trade response may be enough to push stocks higher. The index definitely looks set to close higher on Friday to end June with an incredible gain.
Stock Market Outlook Archives
Stock Market Outlook For Wed May 6 2026 – Choppy But Higher Still

Morning Investing Strategy Notes for Tue May 5 2026

Stock Market Outlook For Tue May 5 2026 – Overbought and Lower

Morning Investing Strategy Notes for Mon May 4 2026
Stock Market Outlook For Mon May 4 2026 – Dips Likely With Possible Lower Close

Morning Investing Strategy Notes for Fri May 1 2026
Stock Market Outlook For Fri May 1 2026 – Overbought But Higher

Morning Investing Strategy Notes for Thu Apr 30 2026
Stock Market Outlook For Thu Apr 30 2026 – Dips Likely Possible Lower Close
Morning Investing Strategy Notes for Wed Apr 29 2026
Stock Market Outlook For Wed Apr 29 2026 – Choppy But Higher Ahead Of More Earnings

Morning Investing Strategy Notes for Tue Apr 28 2026