

Thursday saw investors try to decide which stocks should be bought heading into the new Fed “normal” and which ones should be dropped. Financials continued their decline as did industrials. Tech stocks that were out of favor just a few weeks ago and labeled as “dead money” were being picked up. Over the lunch hour the SPX fell to below 4200 before buyers stepped in and pushed the index all the way back to above 4225 within an hour. The close saw a slight loss of 1.84 points to end the day at 4221. The NASDAQ rose 121 points as investors were picking up tech names. The index closed at 14161.
Stock Market Outlook Chart Comments At The Close on Thu Jun 17 2021
Thursday the S&P dipped intraday to break the 21 day moving average before closing back above it.
The dip however left a bearish closing candlestick for Friday. At the same time, the doji candlestick at the close on Thursday also often signals a bounce could happen after 3 days of red candlesticks.
Two events remain important. The Upper Bollinger Band is not rising and the Lower Bollinger Band is turning back up. These are bearish signals.
The 21 day is turning back down following two days of selling. That too is bearish.
Meanwhile the 50, 100 and 200 day moving averages are climbing. These are bullish signals.
Overall the SPX chart is still more bullish than bearish but number of bearish signals has grown.
One other technical indicator to mention is the number of doji candlesticks that are short tops with a long shadow since April as the index has pushed above the 4200 level. Normally this many “doji” candlesticks over such a long period of time can be bearish. Also note how long the Bollinger Bands have stayed close to each other since the middle of May. Again this is bearish. While perhaps not a major concern at this point, both of these signals need to be watched for any further signals that advise the index will dip lower before trying for another rally.
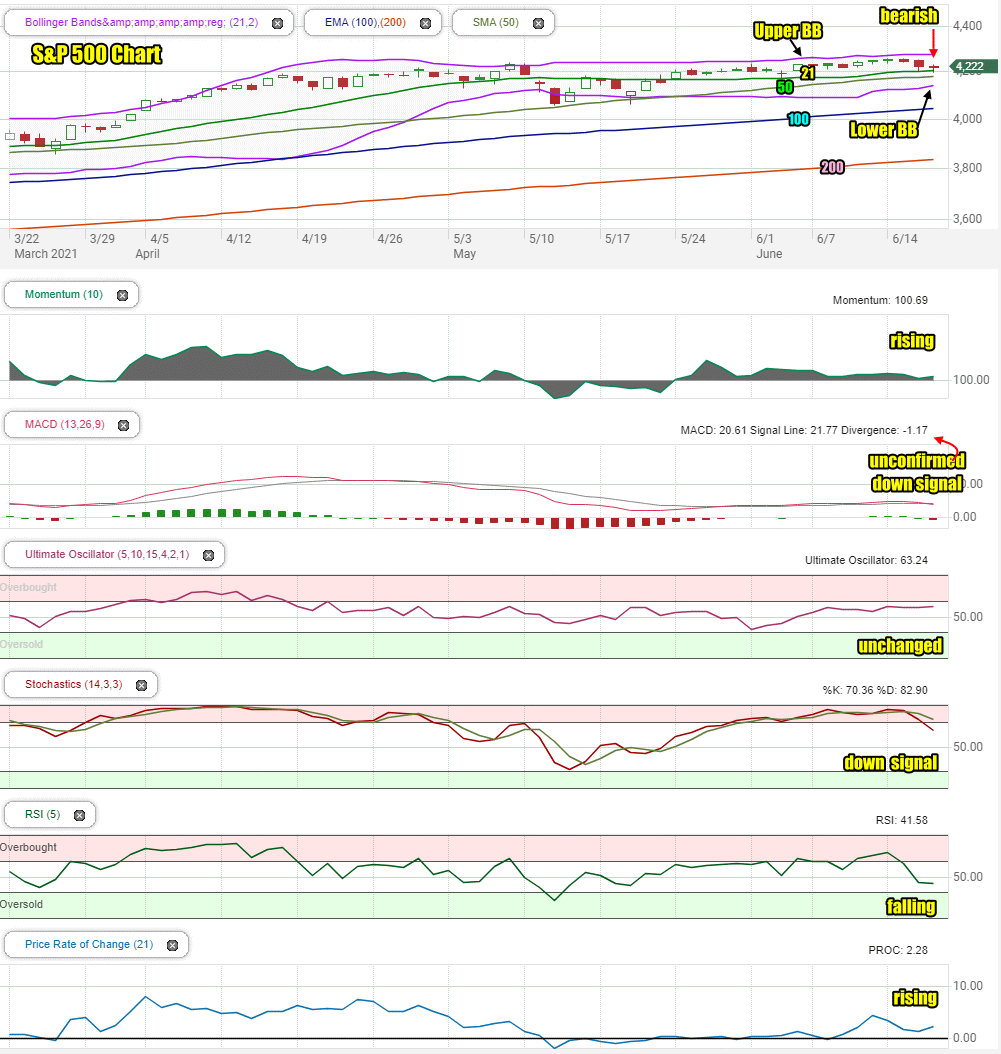
Stock Market Outlook review of Thu Jun 17 2021
Stock Market Outlook: Technical Indicators Review:
Momentum: Momentum is rising and positive.
- Settings: For momentum I use a 10 period when studying market direction.
MACD Histogram: MACD (Moving Averages Convergence / Divergence) issued an up signal on Friday May 28 2021. On Thursday the up signal changed to an unconfirmed down signal.
- Settings: For MACD Histogram, I am using the Fast Points set at 13, Slow Points at 26 and Smoothing at 9.
Ultimate Oscillator: The Ultimate Oscillator is trending unchanged.
- Settings: The Ultimate Oscillator settings are: Period 1 is 5, Period 2 is 10, Period 3 is 15, Factor 1 is 4, Factor 2 is 2 and Factor 3 is 1. These are not the default settings but are the settings I use with the S&P 500 chart set for 1 to 3 months.
Slow Stochastic: The Slow Stochastic has a down signal in place for tomorrow and is overbought.
Settings: For the Slow Stochastic I use the K period of 14 and D period of 3. The Slow Stochastic tries to predict the market direction further out than just one day.
Relative Strength Index: The RSI signal is falling for a third day.
- Settings: The relative strength index is set for a period of 5 which gives it 5 days of market movement to monitor. It is often the first indicator to show an overbought or oversold signal.
Rate of Change: The rate of change signal is rising which indicates prices will be changing more than expected on Friday, both higher and lower.
- Settings: Rate Of Change is set for a 21 period. This indicator looks back 21 days and compares price action from the past to the present. With the Rate Of Change, prices are rising when signals are positive. Conversely, prices are falling when signals are negative. As an advance rises the Rate Of Change signal should also rise higher, otherwise the rally is suspect. A decline should see the Rate Of Change fall into negative signals. The more negative the signals the stronger the decline.
Support and Resistance Levels To Be Aware Of:
4250 is resistance
4225 is resistance
4200 is resistance
4175 is light support and just below the 50 day moving average
4150 is light support
4100 is light support
4070 is very light support
4050 is light support and is where the 100 day moving average rests
4000 is good support
3900 is support
3850 is support
3800 is support and just below the 200 day moving average
3750 is good support
3700 is light support
3680 is light support
3600 is strong support
Stock Market Outlook for Tomorrow – Fri Jun 18 2021
Friday could easily see a bounce following a third bearish candlestick. The doji candlestick seen on Thursday at the close, often signals an impending bounce.
At the same time momentum is also pointing higher.
Aside from those two signals, the remaining signals are bearish and MACD issued a new, but unconfirmed down signal on Thursday. The down signal was fairly strong at negative 1.17. A stronger down signal will confirm if the next move is lower for the index.
On Friday investors should expect a bounce attempt but a lower day by the close as we prepare to enter the final week of January. A week that historically has been negative 90% of the time over the past 30 years.
Stock Market Outlook Archives
Stock Market Outlook For Wed May 6 2026 – Choppy But Higher Still

Morning Investing Strategy Notes for Tue May 5 2026

Stock Market Outlook For Tue May 5 2026 – Overbought and Lower

Morning Investing Strategy Notes for Mon May 4 2026
Stock Market Outlook For Mon May 4 2026 – Dips Likely With Possible Lower Close

Morning Investing Strategy Notes for Fri May 1 2026
Stock Market Outlook For Fri May 1 2026 – Overbought But Higher

Morning Investing Strategy Notes for Thu Apr 30 2026
Stock Market Outlook For Thu Apr 30 2026 – Dips Likely Possible Lower Close
Morning Investing Strategy Notes for Wed Apr 29 2026
Stock Market Outlook For Wed Apr 29 2026 – Choppy But Higher Ahead Of More Earnings

Morning Investing Strategy Notes for Tue Apr 28 2026