

FullyInformed.com
Generic filters

Stock Market Outlook for Fri Jun 14 2024 – Unchanged At Overbought – Dips Likely

Jun 14, 2024 | Stock Market Outlook

Overbought But Bullish

Prior Trading Day Summary:

On Thursday the SPX dipped lower down to 5400 but not below it. The close was higher at 5433 for a gain of 13 points and another new closing high. On the index though, volume and the number of stocks falling are outweighing advancers which is a sign of weakness.

The NASDAQ also made another new high rising 59 points to end the day at 17,667.

On the NASDAQ 61% of all stocks were falling on Thursday, which is a sign of weakness.

Let review the closing technical signals from Thu Jun 13 2024 to see what to expect for Fri Jun 14 2024.


Stock Market Outlook: SPX Closing Chart For Thu Jun 13 2024

The index closed above the 21 day moving average and above the Upper Bollinger Band. This is bullish and signals overbought.

The closing candlestick is bullish but also indicates a dip is likely today with a potential lower close.

The 21 day moving average is still climbing continuing the latest up signal.

The 50 day moving average is climbing which is bullish.

The 200 day moving average is still climbing. The 200 day is at 4891 which is bullish and the 100 day is also climbing to 5109.

The Lower Bollinger Band is above the 50 day moving average but starting to turn back lower. The Upper Bollinger Band is turned higher. Both are starting to signal an end to the latest Bollinger Bands Squeeze.

The S&P chart is bullish but the closing candlestick is warning of dips again on Friday.
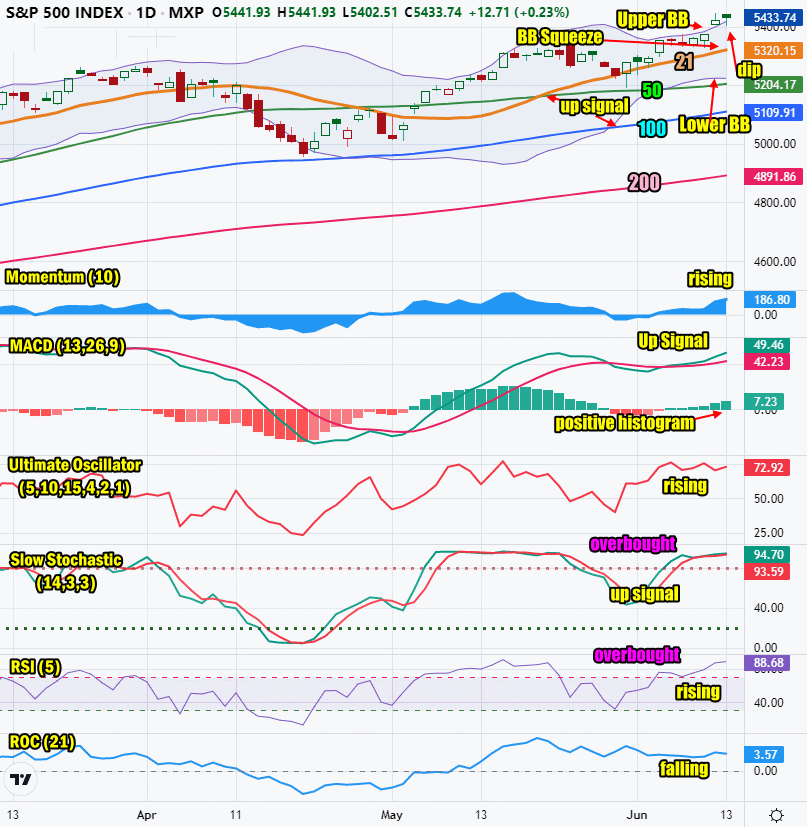
SPX Stock Market Outlook review of Thu Jun 13 2024 – chart courtesy TradingView


Stock Market Outlook: Technical Indicators Review

Momentum: Momentum is rising and positive.

  • Settings: For momentum I use a 10 period when studying market direction.
MACD Histogram: MACD (Moving Averages Convergence / Divergence) issued an up signal on Thu Jun 6 2024. On Thu Jun 13 2024 the up signal was stronger. The MACD histogram gained strength.

  • Settings: For MACD Histogram, I am using the Fast Points set at 13, Slow Points at 26 and Smoothing at 9. 
Ultimate Oscillator: The Ultimate Oscillator is rising and positive.

  • Settings: The Ultimate Oscillator settings are: Period 1 is 5, Period 2 is 10, Period 3 is 15, Factor 1 is 4, Factor 2 is 2 and Factor 3 is 1. These are not the default settings but are the settings I use with the S&P 500 chart set for 1 to 3 months.
Slow Stochastic: The Slow Stochastic has an up signal in place and is overbought.

  • Settings: For the Slow Stochastic I use the K period of 14 and D period of 3. The Slow Stochastic tries to predict the market direction further out than just one day.
Relative Strength Index: The RSI signal is rising and overbought.

  • Settings: The relative strength index is set for a period of 5 which gives it 5 days of market movement to monitor.  It is often the first indicator to show an overbought or oversold signal.
Rate of Change: The rate of change signal is falling signaling that Friday will end lower.

  • Settings: Rate Of Change is set for a 21 period. This indicator looks back 21 days and compares price action from the past to the present. With the Rate Of Change, prices are rising when signals are positive. Conversely, prices are falling when signals are negative. As an advance rises, the Rate Of Change signal should also rise higher, otherwise the rally is suspect. A decline should see the Rate Of Change fall into negative signals. The more negative the signals the stronger the decline.

Stock Market Outlook: Support and Resistance Levels

5450 is resistance
5425 is resistance
5400 is resistance
5375 is resistance
5350 is resistance
5325 is resistance
5310 is resistance
5300 is resistance
5275 is resistance
5250 is light support
5225 is light support
5200 is good support
5190 is light support
5175 is light support
5150 is support
5125 is support
5115 is support
5100 is support


Stock Market Outlook for Fri Jun 14 2024 

For Friday the rally is narrowing daily which means at some point the index will slip lower to find buyers. Friday looks weak but perhaps not weak enough to see the index closed below 5400.

The CPI numbers came in lower than expected which helped stocks on Thursday. Friday though has no such number for stocks to rely on. A negative close is possible for Friday.


Potential Economic and Political Market Moving Events

This is a big week for economic numbers.

Monday:

No reports

Tuesday:

No reports

Wednesday:

8:30 Consumer Price Index was expected to rise just 0.1% but did not rise at all.

8:30 CPI year-over-year was estimated unchanged at 3.4% but came in at 3.3%

8:30 Core CPI was estimated unchanged at 0.3% but came in at 0.2%

8:30 Core CPI year-over-year is estimated to drop to 3.5%

2:00 FOMC interest rate decision announcement

2:00 Monthly federal deficit was expected to drop to -262.5 billion

2:30 Fed Chair Powell news conference

Thursday:

8:30 Weekly Initial Unemployment Insurance Claims were estimated at 225,000 but came in higher at 242,000

8:30 Producer Price Index was expected to rise 0.1% but fell to -0.2%

8:30 Core PPI was expected at 0.2% but fell to 0.0%

Friday:

8:30 Import price index is expected to be flat at 0.0%

10:00 Consumer sentiment is expected to be 71.5, up from the prior reading of 69.1


Recent Outlooks

Stock Market Outlook For Thu Nov 19 2026 – Bounce Attempt Likely But Remaining Bearish

Prior Trading Day Summary The fact that NVIDIA Stock (NVDA) reported an incredible quarter and the stock fell today, with it already at depressed levels, is a sign that investors should stay cautious. On Wednesday stocks that did rally found …

Morning Investing Strategy Notes for Wed Nov 18 2026

For FullyInformed Members the morning Investing Strategy Notes for Wed Nov 18 2026 look at the selling from Tuesday and the outlook following NVIDIA earnings yesterday after the close and their impact today. Equities reviewed today include NVIDIA Stock (NVDA), …

Stock Market Outlook For Wed Nov 18 2026 – Bounce Expected But Still Selling Pressure

Prior Trading Day Summary On Tue Nov 17 2026 stocks continued to come under selling pressure. The sell-off widened on Tuesday with the SPX falling below the 200 day early morning and reaching 7288 before rebounding. The close was still …

Morning Investing Strategy Notes for Tue Nov 17 2026

For FullyInformed Members the morning Investing Strategy Notes for Tue Nov 17 2026 look at the selling that continued to dominate Monday. Equities reviewed today include NVIDIA Stock (NVDA), Home Depot Stock (HD), Target Stock (TGT), TJX Stock (TJX), Lowes …

Stock Market Outlook For Tue Nov 17 2026 – Weakness and Lower Ahead Of NVIDIA Earnings Tonight

Prior Trading Day Summary On Mon Nov 16 2026 stocks fell yet again as investors continued their worry over the tech trade and NVIDIA. With worries continuing investors were taking some profits and reducing their overall exposure to the market …

Morning Investing Strategy Notes for Mon Nov 16 2026

For FullyInformed Members the morning Investing Strategy Notes for Mon Nov 16 2026 look at the past week of market action. Equities reviewed today include NVIDIA Stock (NVDA), Home Depot Stock (HD), Walt Disney Stock (DIS) and more. The morning …

Stock Market Outlook For Mon Nov 16 2026 – Weakness Ahead Of NVIDIA Earnings

Prior Trading Day Summary On Friday Nov 13 2026 stocks were under pressure again as concerns continued over the leaving of NVIDIA CEO Jensen Huang. The stock fell to $158.39 early morning and then managed to climb back to close …

Morning Investing Strategy Notes for Fri Nov 13 2026

For FullyInformed Members the morning Investing Strategy Notes for Fri Nov 13 2026 contain a large number of trades. Equities reviewed today include NVIDIA Stock (NVDA), Fortinet Stock (FTNT), D R Horton Stock (DHI), Cisco Stock, Baidu Stock (BIDU) and …

Stock Market Outlook For Fri Nov 13 2026 – Weak Start But Higher Close

Prior Trading Day Summary As expected, Thu Nov 12 2026 opened lower on news of the resignation of CEO Huang but then the index spent the day recovering to close down just $7.54 or 4.34%. This is a bullish signal …

Morning Investing Strategy Notes for Thu Nov 12 2026

For FullyInformed Members the morning Investing Strategy Notes for Thu Nov 12 2026 look at the potential impact NVIDIA Stock (NVDA) may have on the market today. Equities reviewed today include Fortinet Stock (FTNT), Crowdstrike Stock (CRWD), Johnson and Johnson …

Stock Market Outlook For Thu Nov 12 2026 – Lower Open Thanks To NVIDIA With Weakness Into The Close

Prior Trading Day Summary On Wed Nov 11 2026 NVIDIA Stock (NVDA) bounced and Coreweave Stock (CRWV) soared higher. Apple Stock made a new all-time high and stocks rallied throughout the day. I had expected a bounce in the morning …

Morning Investing Strategy Notes for Wed Nov 11 2026

For FullyInformed Members the morning Investing Strategy Notes for Wed Nov 11 2026 discuss the current market outlook. Equities reviewed today include SQQQ ETF, TQQQ ETF, Coreweave Stock (CRWV),  Franco Nevada Stock (FNV) and more. The morning Investing Strategy Notes …

Stock Market Outlook For Wed Nov 11 2026 – Bounce To Start The Day and Higher Close

Prior Trading Day Summary On Tue Nov 10 2026 with NVIDIA Stock (NVDA) continuing to fall investors took profits after the latest inflation numbers came in much hotter than estimated. The S&P closed down 29 points for a mild loss, …

Morning Investing Strategy Notes for Tue Nov 10 2026

For FullyInformed Members the morning Investing Strategy Notes for Tue Nov 10 2026 discuss the outlook for Tuesday along with comments and trade tips for NVIDIA Stock (NVDA). Equities reviewed today include SQQQ ETF, TQQQ ETF, NVIDIA Stock (NVDA), Coreweave …

Subscribe For The Latest News