
Prior Trading Day Summary:
On Thu Jun 12 2025 stocks dipped to start the day as the Weekly Initial Unemployment Insurance Claims came in slightly higher than estimated at 248,000. This seemed to spook investors who opened the day with the SPX lower. Through the day investors bought and pushed the index higher by the close on both the SPX and NASDAQ.
The SPX closed up 23 points to 6045. Trading volume fell to 4.7 billion shares but 55% of all stocks were rising by the close.
The NASDAQ closed up 46 points to 19662. Volume was the highest of the year coming in at 17 billion shares. 77% of the volume was moving higher by the close.
Lets review the SPX technical indicators from the close on Thu Jun 12 2025 to see what we should expect for Fri Jun 13 2025.
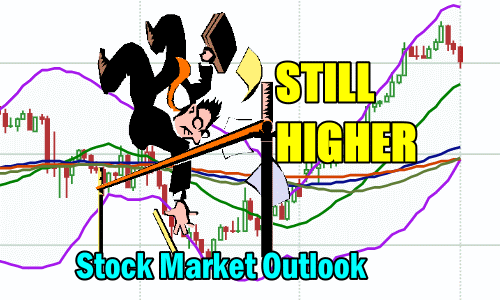
Stock Market Outlook: SPX Closing Chart For Thu Jun 12 2025
The index closed above all major moving averages and at the Upper Bollinger Band. This is bullish.
The closing candlestick is bullish for Friday with no shadows. Normally this indicates the morning could open lower and then climb.
The 21 day moving average is rising and closed at 5939 which is bullish. There are now just two down signals left from the March 7 and Mar 14.
The 50 day moving average is rising and closed at 5661 which is bullish. The 50 day is turning higher toward the 200 day and could move above it by next week.
The 100 day moving average is rising and closed at 5771 which is bullish.
The 200 day moving average is rising and closed at 5698 which is bullish.
The Lower Bollinger Band is above the 100 day but falling. The Upper Bollinger Band is moving higher within the Bollinger Bands Squeeze. At present it looks like the index could fall back as the squeeze gets underway but it is too early to give much of an accurate reading.
For Fri Jun 13 2025 the SPX chart is more bullish than bearish but some signals are still advising caution.

SPX Stock Market Outlook review of Thu Jun 12 2025
Stock Market Outlook: Technical Indicators Review
Momentum: Momentum is falling and positive..
|
MACD Histogram: MACD (Moving Averages Convergence / Divergence) issued a down signal on Fri May 30. The down signal continued on Thu Jun 12 2025.
|
Ultimate Oscillator: The Ultimate Oscillator is rising.
|
Slow Stochastic: The Slow Stochastic has a weak down signal in place.
|
Relative Strength Index: The RSI signal is rising and overbought.
|
| Rate of Change: The rate of change signal is falling signaling Friday will end lower. Settings: Rate Of Change is set for a 21 period. This indicator looks back 21 days and compares price action from the past to the present. With the Rate Of Change, prices are rising when signals are positive. Conversely, prices are falling when signals are negative. As an advance rises, the Rate Of Change signal should also rise higher, otherwise the rally is suspect. A decline should see the Rate Of Change fall into negative signals. The more negative the signals the stronger the decline. |
Stock Market Outlook: Support and Resistance Levels |
| 6050 is resistance |
| 6025 is resistance |
| 6015 is resistance |
| 6000 is resistance |
| 5990 is resistance |
| 5975 is resistance |
| 5950 is resistance |
| 5925 is resistance |
| 5900 is resistance |
| 5850 is resistance |
| 5800 is support |
| 5785 is support |
| 5750 is support |
| 5700 is support |
| 5650 is support |
| 5630 is support |
| 5600 is support |
| 5550 is support |
| 5500 is support |
| 5475 is support |
Stock Market Outlook for Fri Jun 13 2025
For Fri Jun 13 2025 stocks may be weak to start thanks to the international news of Israel attacking targets in Iran. If the market does open lower, don’t expect it to stay lower. The index is positioned to move still higher on Fri Jun 13 2025.
Potential Economic and Political Market Moving Events
Monday:
10:00 Wholesale inventories were better than estimated, coming in at 0.2% versus 0.4% prior
Tuesday:
6:00 NFIB optimism index rose more than expected to 98.8
Wednesday:
8:30 Consumer Price Index rose just 0.1%, below estimates
8:30 CPI year-over-year came in as estimated at 2.4%
8:30 Core CPI was lower than estimated, at 0.1%
8:30 Core CPI year-over-year was below estimates at 2.8%
2:00 Monthly US Federal Budget is estimated at -$310 billion.
Thursday:
8:30 Weekly Initial Unemployment Insurance Claims came in higher than estimated at 248,000
8:30 Producer Price Index was lower than estimated at 0.1%
8:30 Core PPI was well below estimates coming in at 0.1%
8:30 PPI year-over-year was higher than estimated coming in at 2.6%
8:30 Core PPI year-over-year came in lower than estimated at 2.7%.
8