

Day’s Summary
On Thursday stocks opened higher following excellent earnings from a number of companies including META and Royal Caribbean Cruises (RCL). The SPX soared to 4600 but with stocks already very overbought, the jump to 4600 signaled to traders it was time to take profits. By the close the SPX was down 29 points to end the day at 4537. The NASDAQ fell 77 points to end the day at 14,050.
Thursday decline wiped out most of the week’s gains for the SPX and the NASDAQ. Overall though this is traders taking profits and preparing to setup positions for another move higher sometime in August.
It has been an incredible rally in June and then another rally in July. On June 1 the S&P opened at 4183. On Thursday it reached 4600 for a 417 point rally and a gain of 10%. Taking a breather now is not unusual and should afford opportunities for further trades.
Let’s review the technical indicators from the close on Thursday to see if the selling will continue Friday to end the final week of July.
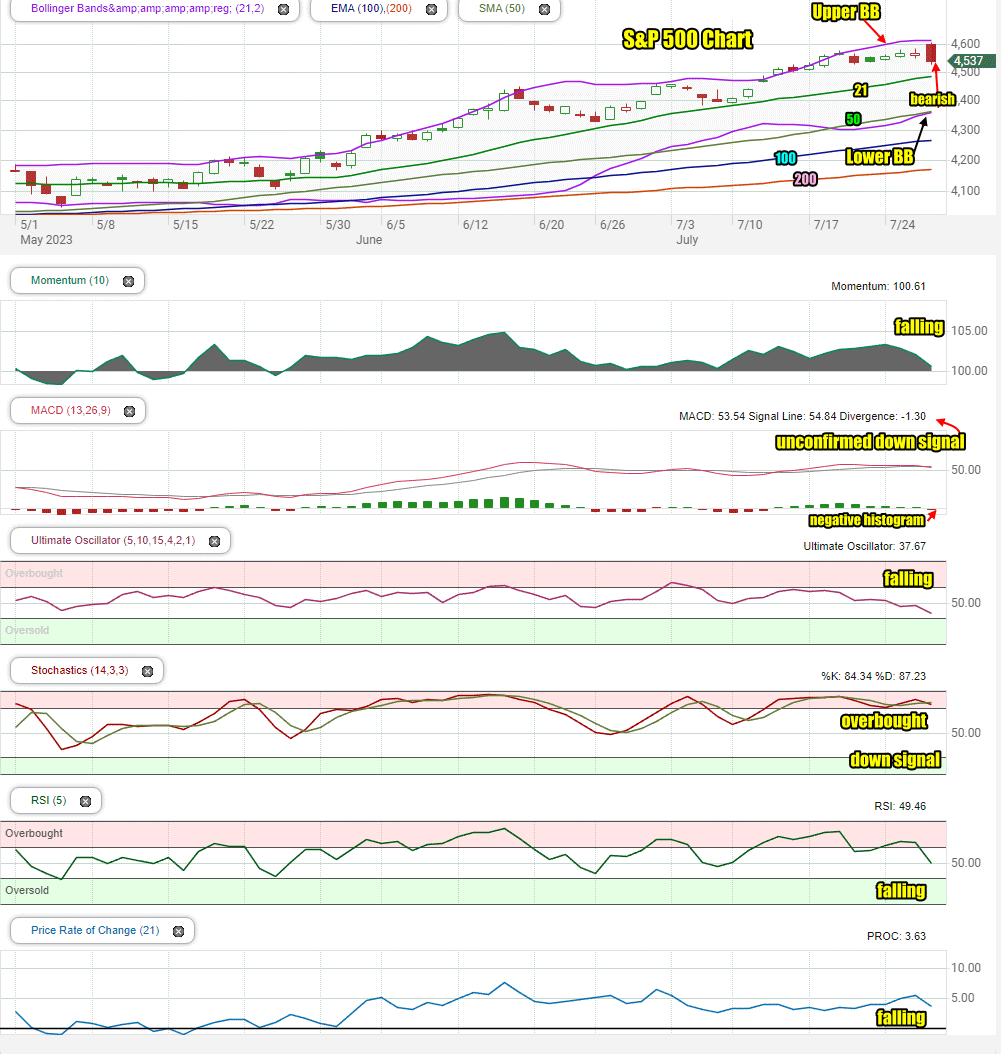
Stock Market Outlook: SPX Closing Chart For Thu Jul 27 2023
The index closed just below the Upper Bollinger Band for the 6th straight day. It is continuing to stay above all moving averages which is still bullish. A move down to at least the 21 day moving average is probably the first likely target.
The closing candlestick on Thursday is bearish for Friday.
The 21, 50, 100 and 200 day moving averages are continuing to climb which is bullish.
The Lower Bollinger Band is climbing and is near crossing above the 50 day moving average. This is still bullish but could turn bearish shortly. The Upper Bollinger Band is moving sideways which could be an indication the index will stop or dip for a day or two.
Stock Market Outlook review of Thu Jul 27 2023
Stock Market Outlook: Technical Indicators Review
Momentum: Momentum is falling and clinging to positive.
|
MACD Histogram: MACD (Moving Averages Convergence / Divergence) issued an up signal on Thursday Jul 13. On Thursday a new unconfirmed down signal was generated.
|
Ultimate Oscillator: The Ultimate Oscillator is falling and negative.
|
Slow Stochastic: The Slow Stochastic has a down signal in place. It is overbought.
|
Relative Strength Index: The RSI signal is falling sharply.
|
Rate of Change: The rate of change signal is falling.
|
Stock Market Outlook: Support and Resistance Levels |
| 4600 is resistance |
| 4575 is resistance |
| 4550 is resistance |
| 4525 is resistance |
| 4500 is resistance |
| 4485 is resistance |
| 4470 is resistance |
| 4450 is support |
| 4435 is support |
| 4420 is support |
| 4400 is support |
| 4390 is support |
| 4370 is support |
| 4350 is support |
| 4340 is support |
| 4325 is support |
| 4310 is support |
| 4300 is support |
| 4290 is support |
| 4275 is support |
| 4250 is support |
| 4240 is support |
| 4225 is support |
| 4210 is support |
| 4200 is good support |
Stock Market Outlook for Fri Jul 28 2023
For Friday the S&P closing candlestick is advising another down day is likely. The technical indicators have shifted to a bias lower and the MACD technical indicator issued an unconfirmed down signal at the close on Thursday.
For Friday I expect a lower day with a number of bounce attempts but dips as deep as 4500 are expected.
Potential Economic and Political Market Moving Events
On Thursday the GDP number was a lot higher than estimated, coming in at 2.4%. Many analysts believe the Fed will continue to raise rates this fall until we see a rise in unemployment.
Friday:
8:30 Personal income and spending
8:30 PCE index including core and year-over-year.
10:00 Consumer sentiment