

Two events were important on Thursday. The first was that the technical indicator, Moving Average Convergence / Divergence (MACD) issued an unconfirmed down signal by the close of trading. The second was that, despite the weakness on Thursday, the index closed up on the day and at 2995. Let’s review the technical indicators to see what they can advise about Friday’s market.
Stock Market Outlook Chart Comments At The Close on Thu Jul 18 2019
The index closed below the Upper Bollinger Band again however intraday, the market bounced off the Middle Bollinger Band. The bounce off the 21 day is significant. Normally that type of move is retested on the next day and the index either moves back up or it deteriorates and begins to move below the Middle Bollinger Band. (The Middle Bollinger Band is also the 21 day moving average)
The closing candlestick was bullish for Friday. This is the first bullish closing candlestick in three days.
The Bollinger Bands are beginning to see a potential change as the Upper Bollinger Band is turning lower while the Lower Bollinger Band is pushing above the 50 day. There could be a Bollinger Bands Squeeze setting up for next week which should be watched.
The 200 day moving average is advancing further above the 2800 level which is bullish and the 100 day continues to move up as well. Note that the 50 day moving average is not actually climbing. That could be a signal to watch.
The chart is less bullish for Friday.
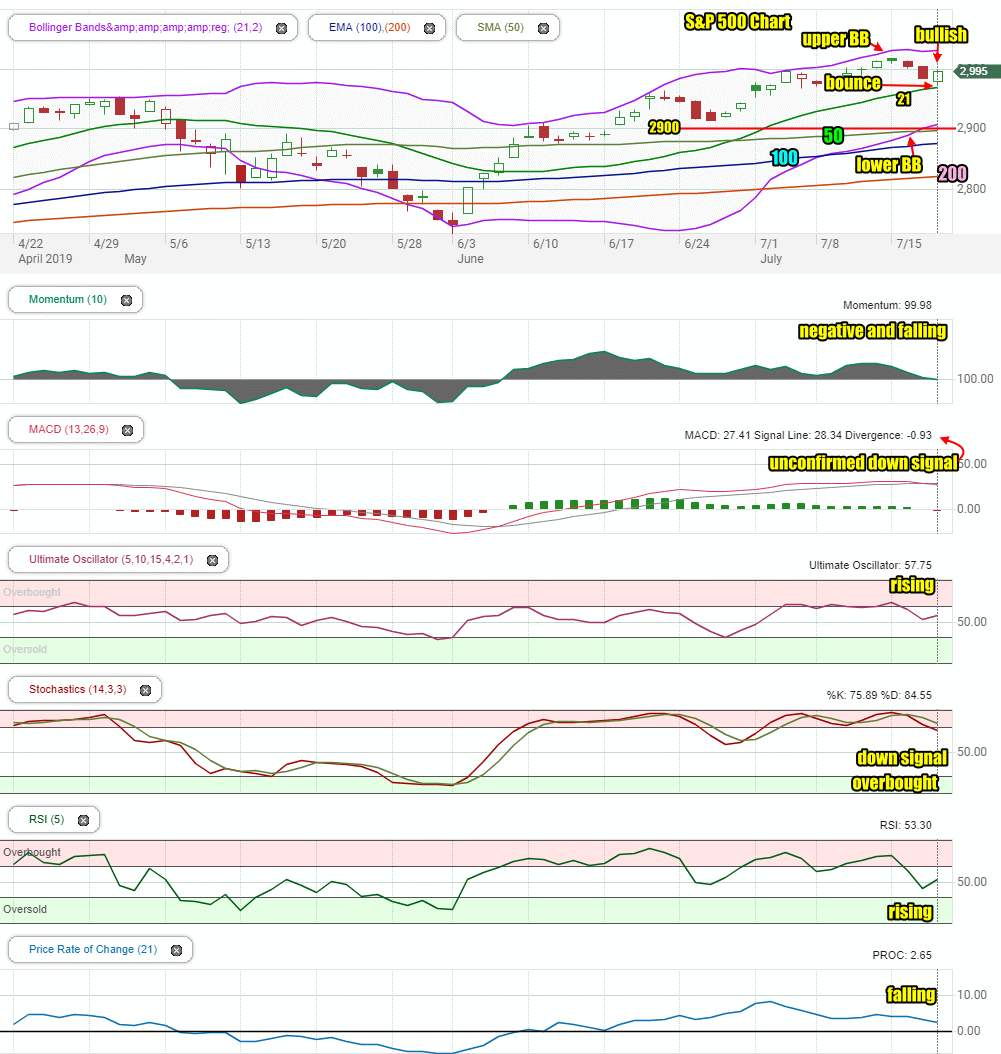
Stock Market Outlook: Technical Indicators Review:
Momentum: Momentum is positive and falling for a fourthd day.
- Settings: For momentum I use a 10 period when studying market direction.
MACD Histogram: MACD (Moving Averages Convergence / Divergence) issued an up signal on Thursday June 6. The up signal was lost on Thursday and an unconfirmed down signal was issued today. We now need to see if the next reading is lower again. If it is it will confirm the down signal.
- Settings: For MACD Histogram, I am using the Fast Points set at 13, Slow Points at 26 and Smoothing at 9.
Ultimate Oscillator: The Ultimate Oscillator signal is positive and rising.
- Settings: The Ultimate Oscillator settings are: Period 1 is 5, Period 2 is 10, Period 3 is 15, Factor 1 is 4, Factor 2 is 2 and Factor 3 is 1. These are not the default settings but are the settings I use with the S&P 500 chart set for 1 to 3 months.
Slow Stochastic: The Slow Stochastic signal has a down signal in place and is still showing the index as overbought.
- Settings: For the Slow Stochastic I use the K period of 14 and D period of 3. The Slow Stochastic tries to predict the market direction further out than just one day.
Relative Strength Index: The RSI signal is rising sharply.
- Settings: The relative strength index is set for a period of 5 which gives it 5 days of market movement to monitor. It is often the first indicator to show an overbought or oversold signal.
Rate of Change: The rate of change signal is falling.
- Settings: Rate Of Change is set for a 21 period. This indicator looks back 21 days and compares price action from the past to the present. With the Rate Of Change, prices are rising when signals are positive. Conversely, prices are falling when signals are negative. As an advance rises the Rate Of Change signal should also rise higher, otherwise the rally is suspect. A decline should see the Rate Of Change fall into negative signals. The more negative the signals the stronger the decline.
Support and Resistance Levels To Be Aware Of:
3000 is resistance
2950 is light support
2900 is light support
2860 is better support
2830 is light support
2800 is strong support
2795 is light support
2745 to 2750 is light support
2725 is light support
2700 is light support
2675 is light support
2650 is support
2625 is light support
2600 is support.
Stock Market Outlook for Tomorrow – Fri Jul 19 2019
For Friday the market will contend with the unconfirmed sell signal from MACD. Since the year 2010, the MACD signals have been primarily accurate in 82% of the signals generated.
The technical indicators are also split. MACD is signaling down and 3 other indicators are confirming that the next move will be down for stocks.
Two other indicators are signaling higher.
With this split in outlook, the S&P still looks set on Friday to try to push higher but close flat to only slightly up. That could change the MACD down signal.
A confirmation of the down signal in MACD will be poor for stocks. The futures for Friday, after the close, are pointing to a higher day tomorrow especially on the back of very strong earnings numbers from Microsoft. Let’s hope the futures are right. A higher close should reverse the down signal from MACD.
Stock Market Outlook Archives
Stock Market Outlook For Wed May 6 2026 – Choppy But Higher Still

Morning Investing Strategy Notes for Tue May 5 2026

Stock Market Outlook For Tue May 5 2026 – Overbought and Lower

Morning Investing Strategy Notes for Mon May 4 2026
Stock Market Outlook For Mon May 4 2026 – Dips Likely With Possible Lower Close

Morning Investing Strategy Notes for Fri May 1 2026
Stock Market Outlook For Fri May 1 2026 – Overbought But Higher

Morning Investing Strategy Notes for Thu Apr 30 2026
Stock Market Outlook For Thu Apr 30 2026 – Dips Likely Possible Lower Close
Morning Investing Strategy Notes for Wed Apr 29 2026
Stock Market Outlook For Wed Apr 29 2026 – Choppy But Higher Ahead Of More Earnings

Morning Investing Strategy Notes for Tue Apr 28 2026