

Day’s Summary
Thursday saw stocks shoot higher with the latest PPI reports pointing to lower inflation. Investors snapped up more stocks in a wide ranging day of trading. Intraday the SPX and NASDAQ made new 52 week highs once again. The SPX closed above 4500.
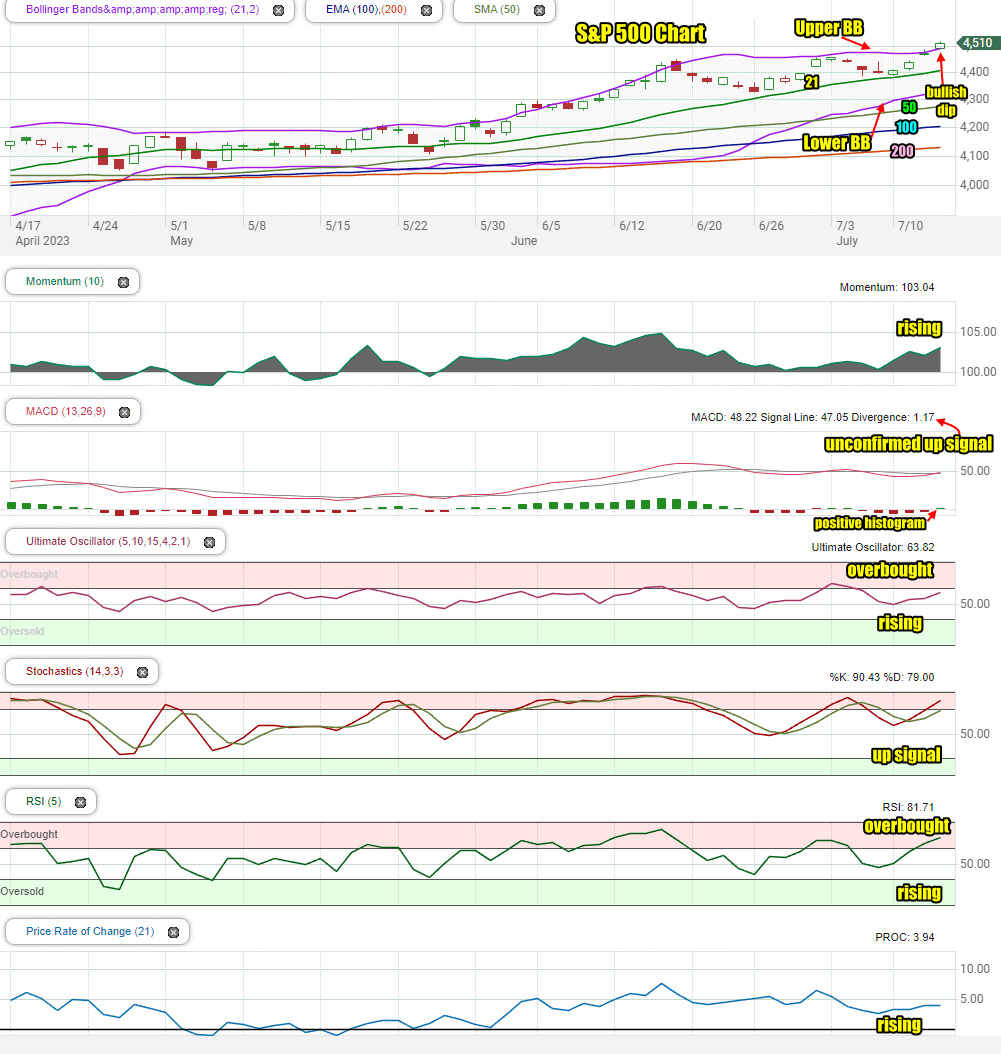
Volume was lower on the SPX but the NASDAQ saw rising volume above 5 billion shares traded.
Let’s review the technical indicators from the close on Thursday to see what we should expect for Friday’s market.
Stock Market Outlook: SPX Closing Chart For Thu Jul 13 2023
The index closed above the Upper Bollinger Band and all moving averages which is bullish. The candlestick is bullish for Friday but also warning that dips are likely.
The closing candlestick on Thursday points to a higher day on Friday by the close.
The 21, 50, 100 and 200 day moving averages are continuing to climb which is bullish. The Lower Bollinger Band is rising and pushing still higher above the 50 day moving average which is bearish. The Upper Bollinger Band is turning up which is bullish. The SPX is still in the latest Bollinger Bands Squeeze.
Stock Market Outlook review of Thu Jul 13 2023
Stock Market Outlook: Technical Indicators Review
Momentum: Momentum is rising and positive. The signals are reaching levels usually followed by a dip back in stocks.
|
MACD Histogram: MACD (Moving Averages Convergence / Divergence) issued an unconfirmed up signal. The MACD histogram also showed positive.
|
Ultimate Oscillator: The Ultimate Oscillator is rising and reaching into overbought readings.
|
Slow Stochastic: The Slow Stochastic has an up signal in place. It is near overbought readings.
|
Relative Strength Index: The RSI signal is rising sharply and into overbought readings.
|
Rate of Change: The rate of change signal is rising.
|
Stock Market Outlook: Support and Resistance Levels |
| 4500 is resistance |
| 4485 is resistance |
| 4470 is resistance |
| 4450 is resistance |
| 4435 is resistance |
| 4420 is resistance |
| 4400 is strong resistance |
| 4390 is resistance |
| 4370 is resistance |
| 4350 is support |
| 4340 is support |
| 4325 is support |
| 4310 is support |
| 4300 is support |
| 4290 is support |
| 4275 is support |
| 4250 is support |
| 4240 is support |
| 4225 is support |
| 4210 is support |
| 4200 is good support |
Stock Market Outlook for Fri Jul 14 2023
For Friday the technical indicators are primarily showing the index as overbought and ready for a pullback.
The MACD up signal should see stocks end the day higher but dips will occur and could be deeper than expected. They are opportunities to setup new trades.
Potential Economic and Political Market Moving Events
Thursday
8:30 Import price index
10:00 Consumer sentiment is expected to show a slight gain to 65.5