
 Thu Jan 28 2021 saw another wild day on the markets with many brokerages limiting trades, particularly buying, on a number of stocks being pressured higher and forcing short sellers to cover positions. These included GameStop Stock, AMC Entertainment, BlackBerry , Bed Bath & Beyond Stock, Nokia, Koss, American Airlines and others. This put a floor under the selling on Thursday and the markets roared back.
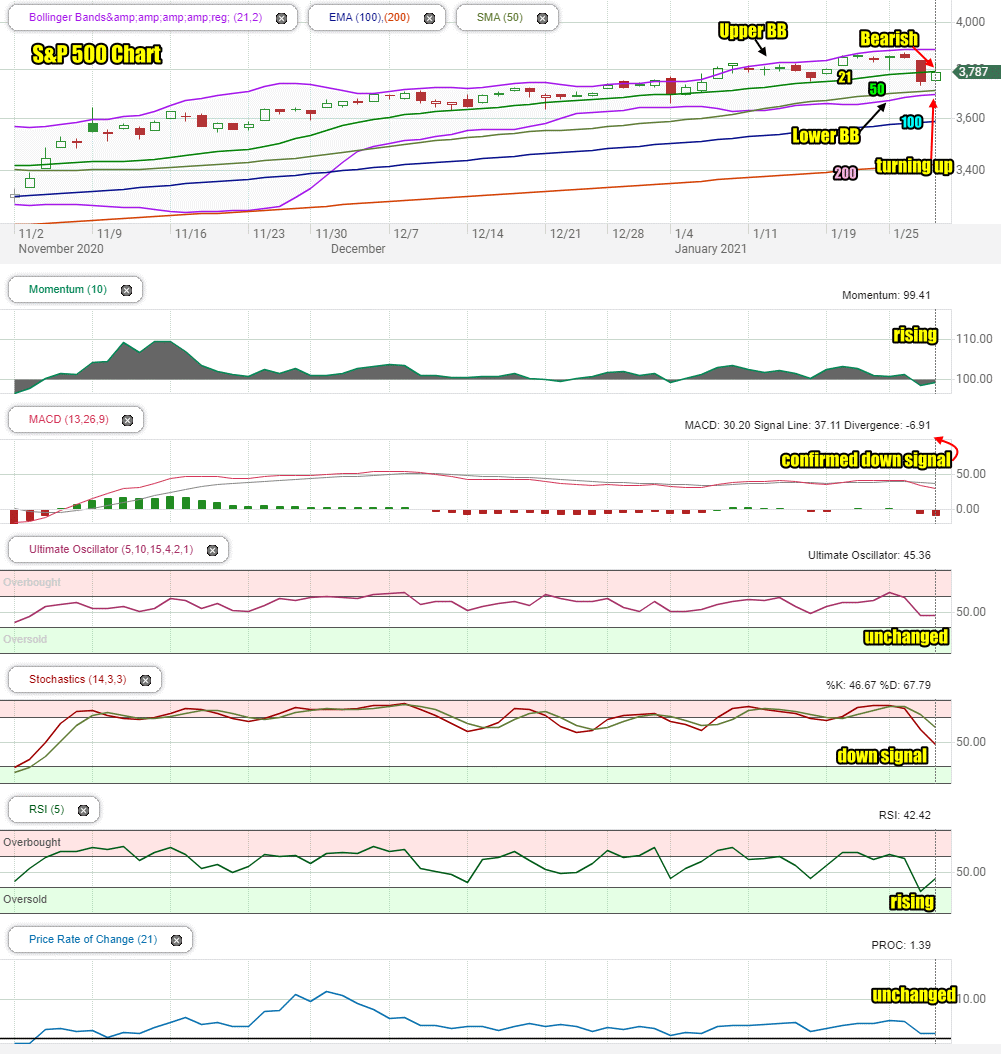
At one point the S&P was at 3830 but then selling took hold sending the index lower in the afternoon to end the day at 3787, back below the 3800 level, but up 36 points on the day.
Overall it had all the appearance of a one or two day rally after a major sell-off. It did not look like it would set the stage for a move back to the all-time highs.
Stock Market Outlook Chart Comments At The Close on Thu Jan 28 2021
Thursday saw the S&P moved back above the 21 day moving average but close below it. This left behind a bearish candlestick for Friday.
The 200, 100, 50 and 21 day moving averages are all climbing still but we shouldn’t expect them to turn down for a few days yet, and only if the index were to move lower over the next several days.
The Upper Bollinger Band is no longer climbing. The Lower Bollinger Band is still turning back up which is also bearish.
The chart continues to look weak.
Stock Market Outlook review of Thu Jan 28 2021
Stock Market Outlook: Technical Indicators Review:
Momentum: Momentum is rising and negative.
- Settings: For momentum I use a 10 period when studying market direction.
MACD Histogram: MACD (Moving Averages Convergence / Divergence) issued a down signal on Wed Jan 27 2021. On Thursday the down signal was confirmed.
- Settings: For MACD Histogram, I am using the Fast Points set at 13, Slow Points at 26 and Smoothing at 9.
Ultimate Oscillator: The Ultimate Oscillator is unchanged.
- Settings: The Ultimate Oscillator settings are: Period 1 is 5, Period 2 is 10, Period 3 is 15, Factor 1 is 4, Factor 2 is 2 and Factor 3 is 1. These are not the default settings but are the settings I use with the S&P 500 chart set for 1 to 3 months.
Slow Stochastic: The Slow Stochastic has a strong down signal in place for a third straight day.
Settings: For the Slow Stochastic I use the K period of 14 and D period of 3. The Slow Stochastic tries to predict the market direction further out than just one day.
Relative Strength Index: The RSI signal is rising from oversold.
- Settings: The relative strength index is set for a period of 5 which gives it 5 days of market movement to monitor. It is often the first indicator to show an overbought or oversold signal.
Rate of Change: The rate of change signal is unchanged.
- Settings: Rate Of Change is set for a 21 period. This indicator looks back 21 days and compares price action from the past to the present. With the Rate Of Change, prices are rising when signals are positive. Conversely, prices are falling when signals are negative. As an advance rises the Rate Of Change signal should also rise higher, otherwise the rally is suspect. A decline should see the Rate Of Change fall into negative signals. The more negative the signals the stronger the decline.
Support and Resistance Levels To Be Aware Of:
3850 is resistance
3800 is support
3750 is support
3700 is light support
3600 is strong support
3550 is support
3500 is strong support
3450 is support
3400 is support
3375 is support
3300 is strong support
3275 is support
3200 is support
3150 is support
3050 is support
3000 is strong support
Stock Market Outlook for Tomorrow – Fri Jan 29 2021
The bounce back on Thursday was great to see but it still had all the trappings of a bear bounce before more selling. The closing candlestick on Thursday was below the 50 day moving average. Normally we can expect another dip lower as the close was not adobe the 50 day.
As well MACD confirmed Wednesday very strong sell signal. Only momentum is rising but it remains negative.
For Friday the S&P may surprise with another rally attempt but unless there is a catalyst to the upside for Friday such as a further ban on trading in those stocks that are pressuring short sellers, the index will close lower to end the week and month. For Friday then we can say “Nice Bounce on Thursday, but lower”.
Stock Market Outlook Archives
Stock Market Outlook For Wed May 6 2026 – Choppy But Higher Still

Morning Investing Strategy Notes for Tue May 5 2026

Stock Market Outlook For Tue May 5 2026 – Overbought and Lower

Morning Investing Strategy Notes for Mon May 4 2026
Stock Market Outlook For Mon May 4 2026 – Dips Likely With Possible Lower Close

Morning Investing Strategy Notes for Fri May 1 2026
Stock Market Outlook For Fri May 1 2026 – Overbought But Higher

Morning Investing Strategy Notes for Thu Apr 30 2026
Stock Market Outlook For Thu Apr 30 2026 – Dips Likely Possible Lower Close
Morning Investing Strategy Notes for Wed Apr 29 2026
Stock Market Outlook For Wed Apr 29 2026 – Choppy But Higher Ahead Of More Earnings

Morning Investing Strategy Notes for Tue Apr 28 2026