

Thursday was all about Meta Stock (FB) and the worst collapse in its history. FB fell 85 points for a 26% loss to end the day at $237.76, just $2.00 above the day’s low. Normally that signals a bounce the following day but further downside shortly after. Meanwhile the S&P fell 112 points to lose 2.4% and end the day at 4477. The NASDAQ tumbled 539 points to end the day down 3.7% at 13,878. Both are major drops in the indexes but futures early morning are should a bounce may occur on Friday. Whether there is a bounce, the technical indicators are warning of more downside ahead.
Let’s review the technical indicators from Thursday to see what investors should expect for Friday, as January’s unemployment report is released at 8:30.
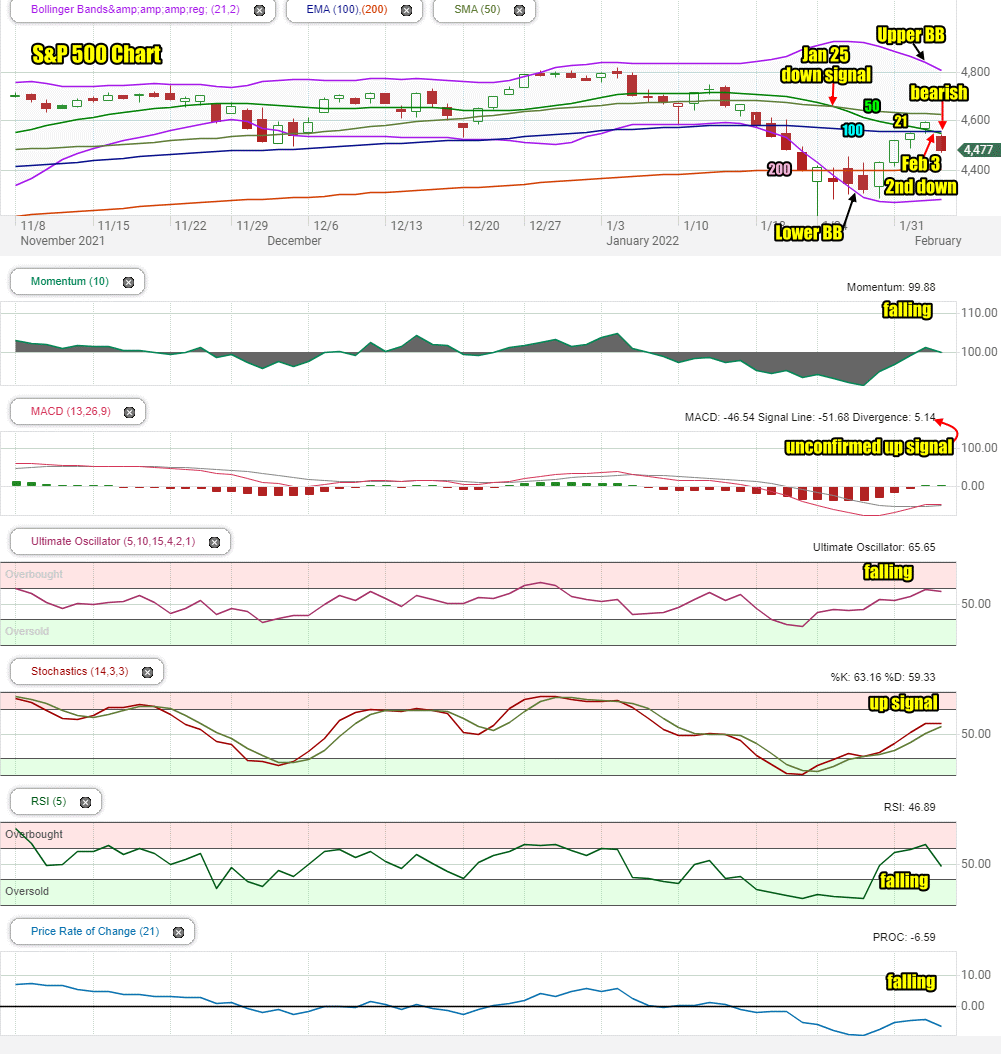
Stock Market Outlook Chart Comments At The Close on Thu Feb 3 2022
The closing candlestick on Thursday is bearish for Friday and indicates we could see a bounce but it is highly suspect. The candlestick closed below the 50, 21 and 100 day moving averages. It ended the day half way to the 200 day moving average.
The selling pushed the 21 day below the 100 day for a second down signal in the SPX chart.
The Upper Bollinger Band is falling sharply which is quite bearish and suggests a pullback is coming. As outlined last night, I bought SPY put options at the open on Thursday and sold them at the close of the day. On Friday on any bounce especially a big one, I will be buying SPY put options.
The Lower Bollinger Band is rising which means that next week we could see a Bollinger Bands Squeeze. For now this is bearish.
The 50 and 100 day moving averages are falling which is bearish. The 200 day moving average is sideways which is neutral.
The chart bearish for Friday even if there is a bounce.
Stock Market Outlook review of Thu Feb 3 2022
Stock Market Outlook: Technical Indicators Review:
Momentum: Momentum is falling and back negative..
- Settings: For momentum I use a 10 period when studying market direction.
MACD Histogram: MACD (Moving Averages Convergence / Divergence) issued a down signal on Thursday Jan 6. On Thursday the up signal from Wednesday remains unconfirmed.
- Settings: For MACD Histogram, I am using the Fast Points set at 13, Slow Points at 26 and Smoothing at 9.
Ultimate Oscillator: The Ultimate Oscillator is positive and falling.
- Settings: The Ultimate Oscillator settings are: Period 1 is 5, Period 2 is 10, Period 3 is 15, Factor 1 is 4, Factor 2 is 2 and Factor 3 is 1. These are not the default settings but are the settings I use with the S&P 500 chart set for 1 to 3 months.
Slow Stochastic: The Slow Stochastic has a weak up signal and as you can see in the technical indicator, the signal could turn negative easily.
Settings: For the Slow Stochastic I use the K period of 14 and D period of 3. The Slow Stochastic tries to predict the market direction further out than just one day.
Relative Strength Index: The RSI signal is falling sharply.
- Settings: The relative strength index is set for a period of 5 which gives it 5 days of market movement to monitor. It is often the first indicator to show an overbought or oversold signal.
Rate of Change: The rate of change signal is falling indicating the chance of a rally holding is low at present.
- Settings: Rate Of Change is set for a 21 period. This indicator looks back 21 days and compares price action from the past to the present. With the Rate Of Change, prices are rising when signals are positive. Conversely, prices are falling when signals are negative. As an advance rises the Rate Of Change signal should also rise higher, otherwise the rally is suspect. A decline should see the Rate Of Change fall into negative signals. The more negative the signals the stronger the decline.
Support and Resistance Levels To Be Aware Of:
4800 is resistance
4725 is resistance
4700 is resistance
4670 is resistance
4655 is resistance
4600 is resistance
4550 is light support
4525 is light support
4500 is medium support
4490 is light support
4475 is light support
4450 is medium support
4400 is good support and the 200 day moving average
4370 is light support
4350 is light support
4300 is good support
4290 is light support
4270 is light support
4250 is good support
4225 is light support
4200 is good support
Stock Market Outlook for Tomorrow – Fri Feb 4 2022
For Friday shares of Amazon and Snap will assist in jump starting a rally, but unemployment numbers for January could derail that, when they come out in the morning at 8:30.
Friday looks poor for stocks. A new down signal was issued on Thursday by the 21 day moving average and the MACD technical indicator did not confirm its recent up signal.
This means any rally has no staying power and the close of the day could still be flat to negative. A big rally would be welcomed but the afternoon and close are the most important. If the rally is given back in the afternoon on Friday, next week will see renewed pressure and a test of the 200 day moving average again, probably as soon as Monday.
Remember any invasion of Ukraine by Russia will probably mean a 10% drop in the indexes, at a minimum.
Stock Market Outlook Archives
Stock Market Outlook For Wed May 6 2026 – Choppy But Higher Still

Morning Investing Strategy Notes for Tue May 5 2026

Stock Market Outlook For Tue May 5 2026 – Overbought and Lower

Morning Investing Strategy Notes for Mon May 4 2026
Stock Market Outlook For Mon May 4 2026 – Dips Likely With Possible Lower Close

Morning Investing Strategy Notes for Fri May 1 2026
Stock Market Outlook For Fri May 1 2026 – Overbought But Higher

Morning Investing Strategy Notes for Thu Apr 30 2026
Stock Market Outlook For Thu Apr 30 2026 – Dips Likely Possible Lower Close
Morning Investing Strategy Notes for Wed Apr 29 2026
Stock Market Outlook For Wed Apr 29 2026 – Choppy But Higher Ahead Of More Earnings

Morning Investing Strategy Notes for Tue Apr 28 2026