

Investors were stunned by the December retail sales numbers which showed the largest one month percentage drop since September 2009. This sent indexes lower at the start of trading. By the close however the NASDAQ was positive and the S&P was lower by just 7 points.
Stock Market Outlook Chart Comments At The Close on Thu Feb 14 2019
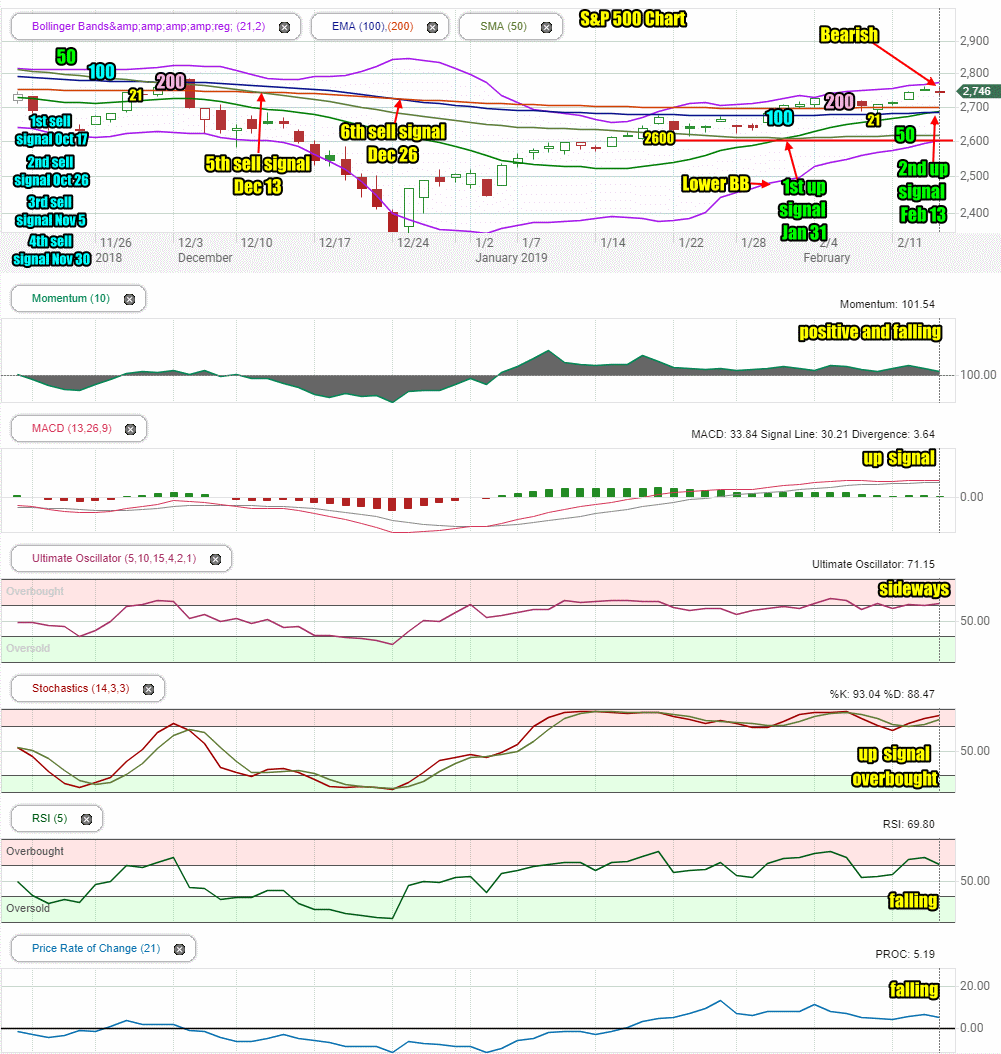
The S&P is still bearish with 6 sell signals.
There are two up signals with the latest one coming just yesterday, Feb 13.
The 200 and 100 day moving averages are not changing and both are continuing to slowly fall. The 50 day is rising.
The index closed above the 200 day moving average on Thursday but the closing candlestick is bearish for Friday.
The Lower Bollinger Band and the Upper Bollinger Band are still climbing indicating there is more upside ahead for the S&P.
The chart is still predominantly bearish but there continue to be signals that the index can push higher.
Stock Market Outlook review of Thu Feb 14 2019
Stock Market Outlook: Technical Indicators Review:
Momentum: Momentum is positive and falling.
- Settings: For momentum I use a 10 period when studying market direction.
MACD Histogram: MACD (Moving Averages Convergence / Divergence) issued an up signal on Fri Jan 4 2019. That up signal was weak again on Thursday but still bullish.
- Settings: For MACD Histogram, I am using the Fast Points set at 13, Slow Points at 26 and Smoothing at 9.
Ultimate Oscillator: The Ultimate Oscillator signal was sideways on Thursday.
- Settings: The Ultimate Oscillator settings are: Period 1 is 5, Period 2 is 10, Period 3 is 15, Factor 1 is 4, Factor 2 is 2 and Factor 3 is 1. These are not the default settings but are the settings I use with the S&P 500 chart set for 1 to 3 months.
Slow Stochastic: The Slow Stochastic has an up signal in place for Friday and is still overbought. This is bullish.
- Settings: For the Slow Stochastic I use the K period of 14 and D period of 3. The Slow Stochastic tries to predict the market direction further out than just one day.
Relative Strength Index: The RSI signal is falling but is more sideways than actually falling or rising. This is neutral.
- Settings: The relative strength index is set for a period of 5 which gives it 5 days of market movement to monitor. It is often the first indicator to show an overbought or oversold signal.
Rate of Change: The rate of change signal is also trending sideways which is also neutral for the outlook.
- Settings: Rate Of Change is set for a 21 period. This indicator looks back 21 days and compares price action from the past to the present. With the Rate Of Change, prices are rising when signals are positive. Conversely, prices are falling when signals are negative. As an advance rises the Rate Of Change signal should also rise higher, otherwise the rally is suspect. A decline should see the Rate Of Change fall into negative signals. The more negative the signals the stronger the decline.
Support Resistance Levels To Be Aware Of:
2900 was support – this will be strong resistance
2860 was support – this will be resistance
2830 was light support and will be light resistance
2800 is strong resistance
2795 is light resistance
2745 to 2750 is light resistance
2725 is light resistance
2700 is light support.
2675 is light support
2650 is support
2625 is light support
2600 is support.
There was good support at the 2550 level which is back to being support.
The 2500 level is support.
The S&P has light support at 2480 and better support at 2450.
There is good support at 2425.
Below that there is some support at 2400, 2380, 2350.
2300 has the most support at present but would represent a full correction of 641 points as a drop to this level would be 21% and just 5% away from a full bear market signal ending the bull market from 2009.
Stock Market Outlook for Tomorrow – Fri Feb 15 2019
The technical indicators are mixed but while the SPX chart is bearish, the technical indicators are more bullish than bearish.
There is still strength in the rally but Friday could see the index close slightly negative following the December retail numbers which will take a day or two for investors to sort out and move beyond.
Meanwhile earnings from NVIDIA should assist in pushing the index higher. We also get the Deere and Company earnings on Friday before markets open. If they are better than expected and the outlook for 2019 is strong, this will assist the markets and push them higher.
Any positive news on the China trade issues will also push indexes higher. But without those, Friday will see the indexes close slightly lower as weakness will dominate on Friday. The market now needs positive news on the China trade issues as another catalyst to push the index higher.
For Friday then, the outlook is for weakness and a slightly lower close, but be prepared that any positive news on the trade issues with China will push stocks higher and quickly.
Stock Market Outlook Archives
Stock Market Outlook For Wed May 6 2026 – Choppy But Higher Still

Morning Investing Strategy Notes for Tue May 5 2026

Stock Market Outlook For Tue May 5 2026 – Overbought and Lower

Morning Investing Strategy Notes for Mon May 4 2026
Stock Market Outlook For Mon May 4 2026 – Dips Likely With Possible Lower Close

Morning Investing Strategy Notes for Fri May 1 2026
Stock Market Outlook For Fri May 1 2026 – Overbought But Higher

Morning Investing Strategy Notes for Thu Apr 30 2026
Stock Market Outlook For Thu Apr 30 2026 – Dips Likely Possible Lower Close
Morning Investing Strategy Notes for Wed Apr 29 2026
Stock Market Outlook For Wed Apr 29 2026 – Choppy But Higher Ahead Of More Earnings

Morning Investing Strategy Notes for Tue Apr 28 2026