
Thursday saw stocks move lower following three strong days of rallying. It was obvious to most investors that Thursday would end lower. Unfortunately the index closed at the low of the day. This often sets the index up for a sharp bounce to start and then more selling intraday and there is a potential for a lower close down at or below the 21 day moving average.
On Thursday the S&P fell 33 points but for the week it is still up 129 points. It closed at 4667. The NASDAQ fell heavier, shedding 269 points but also up 431 points for the week. It closed at 15,517.
Some of the selling was caused by the overbought nature of the markets at present but also by worries about the inflation number due out on Friday.
Let’s review Thursday’s close to see what to expect for Friday.
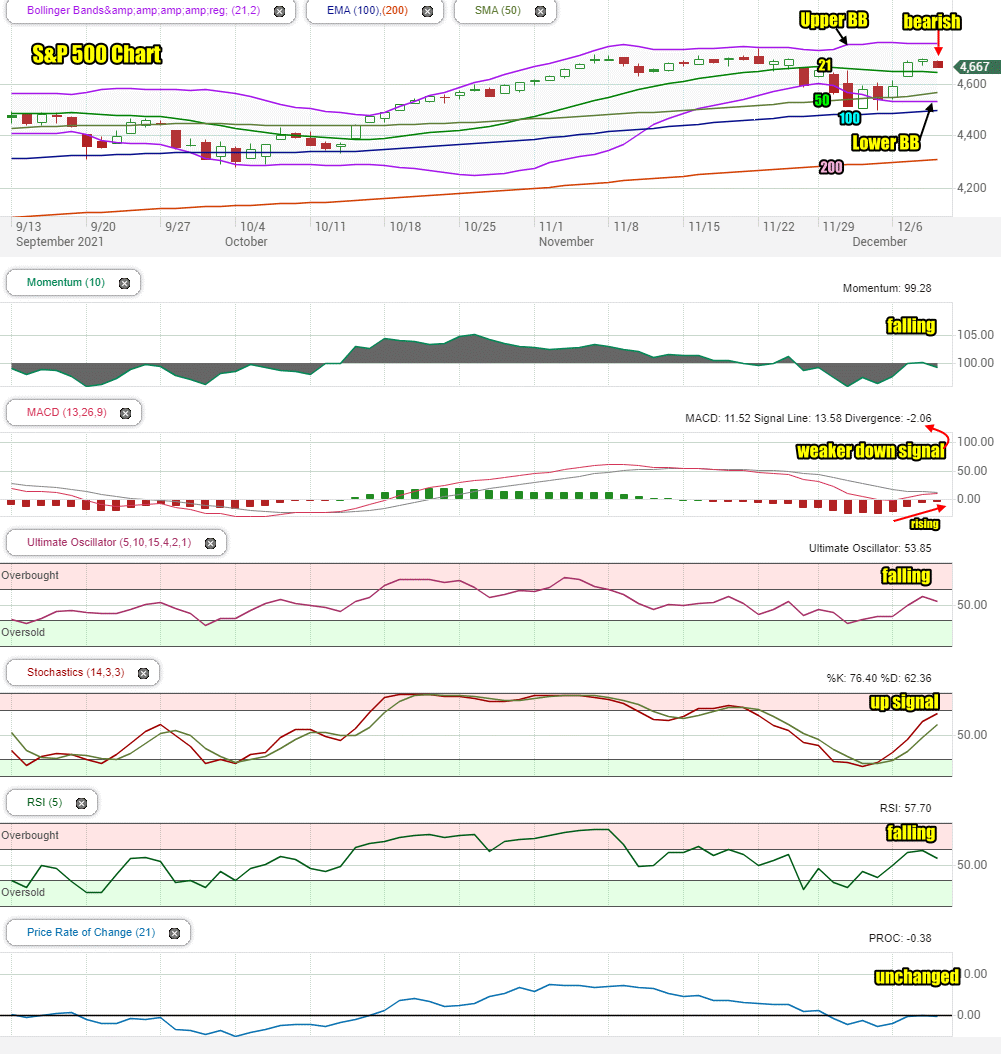
Stock Market Outlook Chart Comments At The Close on Thu Dec 9 2021
The candlestick on Thursday closed just above the 21 day moving average, which is still bullish. The closing candlestick itself though is bearish for Friday.
The 21 day moving average is continuing to fall which is bearish. The other remaining major moving averages, namely the 50, 100 and 200 day are still climbing. This is bullish.
The Bollinger Bands Squeeze is over. The Lower Bollinger Band is trending sideways as is the Lower Bollinger Band. This is bearish for the index at present. Overall the chart is slightly more bearish than bullish for Friday.
Stock Market Outlook review of Thu Dec 9 2021
Stock Market Outlook: Technical Indicators Review:
Momentum: Momentum is falling and back negative.
- Settings: For momentum I use a 10 period when studying market direction.
MACD Histogram: MACD (Moving Averages Convergence / Divergence) issued a down signal on Wed Nov 17 2021 . On Thursday the down signal weakened further despite the market drop. As well, the histogram is showing a rise is still coming shortly.
- Settings: For MACD Histogram, I am using the Fast Points set at 13, Slow Points at 26 and Smoothing at 9.
Ultimate Oscillator: The Ultimate Oscillator is falling.
- Settings: The Ultimate Oscillator settings are: Period 1 is 5, Period 2 is 10, Period 3 is 15, Factor 1 is 4, Factor 2 is 2 and Factor 3 is 1. These are not the default settings but are the settings I use with the S&P 500 chart set for 1 to 3 months.
Slow Stochastic: The Slow Stochastic has an up signal for Friday.
Settings: For the Slow Stochastic I use the K period of 14 and D period of 3. The Slow Stochastic tries to predict the market direction further out than just one day.
Relative Strength Index: The RSI signal is falling.
- Settings: The relative strength index is set for a period of 5 which gives it 5 days of market movement to monitor. It is often the first indicator to show an overbought or oversold signal.
Rate of Change: The rate of change signal is unchanged as it trends sideways.
- Settings: Rate Of Change is set for a 21 period. This indicator looks back 21 days and compares price action from the past to the present. With the Rate Of Change, prices are rising when signals are positive. Conversely, prices are falling when signals are negative. As an advance rises the Rate Of Change signal should also rise higher, otherwise the rally is suspect. A decline should see the Rate Of Change fall into negative signals. The more negative the signals the stronger the decline.
Support and Resistance Levels To Be Aware Of:
4725 is resistance
4700 is resistance
4655 is light support.
4600 is good support
4550 is light support
4525 is light support
4500 is support
Stock Market Outlook for Tomorrow – Fri Dec 10 2021
For Friday the S&P is started the day above the 21 day moving average and above the 4655 support level. A drop down to 4655 during the day won’t be a surprise. The NASDAQ could again be key for the day. If it continues to see heavy volumes and dumping of many shares, the S&P won’t be able to hold up. It will fall lower.
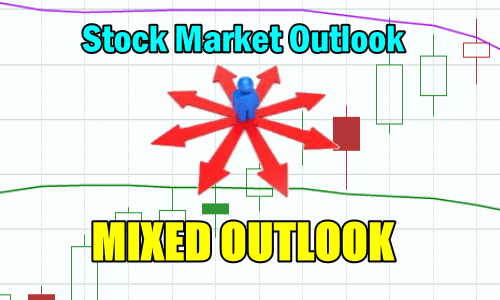
Technical indicators though are mixed. Not all are pointing to a big down day and the end to the 3 day rally. Instead they are mixed which is good for the bulls. The mixed outlook means the index should try to rally, even if it sells lower to start the day. The close though could be poor for stocks. Next week though, stocks should move higher as the MACD technical indicator continued to climb toward an up signal on the S&P. That could be all it takes on Friday to end the week stronger.
Stock Market Outlook Archives
Stock Market Outlook For Wed May 6 2026 – Choppy But Higher Still

Morning Investing Strategy Notes for Tue May 5 2026

Stock Market Outlook For Tue May 5 2026 – Overbought and Lower

Morning Investing Strategy Notes for Mon May 4 2026
Stock Market Outlook For Mon May 4 2026 – Dips Likely With Possible Lower Close

Morning Investing Strategy Notes for Fri May 1 2026
Stock Market Outlook For Fri May 1 2026 – Overbought But Higher

Morning Investing Strategy Notes for Thu Apr 30 2026
Stock Market Outlook For Thu Apr 30 2026 – Dips Likely Possible Lower Close
Morning Investing Strategy Notes for Wed Apr 29 2026
Stock Market Outlook For Wed Apr 29 2026 – Choppy But Higher Ahead Of More Earnings

Morning Investing Strategy Notes for Tue Apr 28 2026