

Prior Trading Day Summary:
On Thursday stocks ended the day at the lows with all three indexes selling off ahead of Fed Chair Powell’s Jackson Hole speech due out on Friday at 10:00.
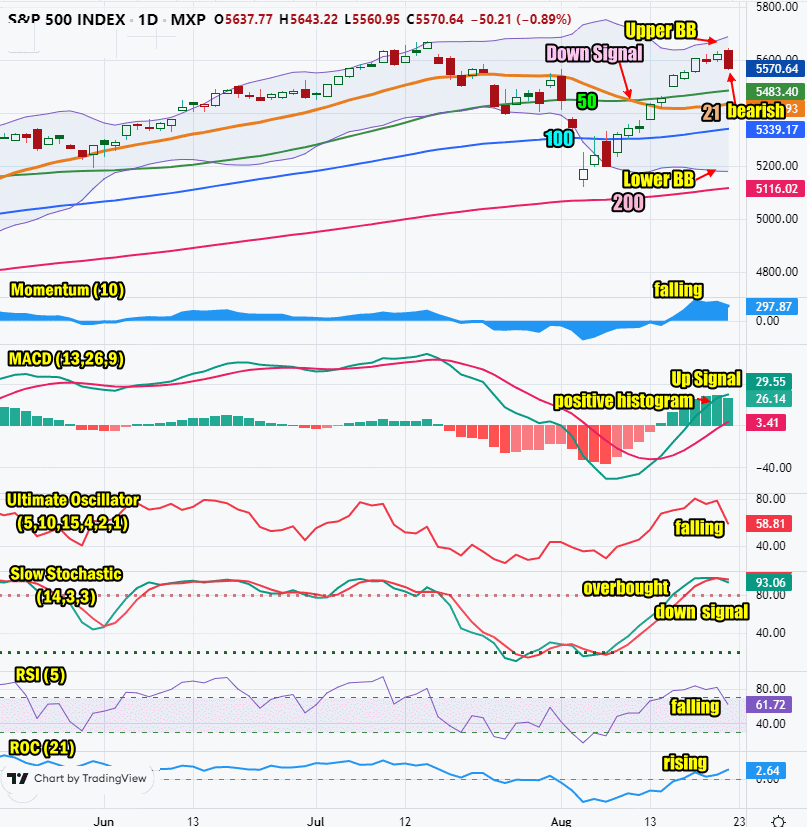
The S&P closed down 50 points to 5570 while the NASDAQ fell 299 points to 17619.
On Thursday an overbought market ran into nervous investors who are worried about interest rates, Powell’s speech on Friday morning and the perceived growing risk of a recession.
The market saw low volume on the SPX with just 3 billion shares traded. The NASDAQ traded 5.2 billion.
Let’s review the closing technical indicators from Thu Aug 22 2024 to see what the signals advise for Fri Aug 23 2024 to end the third week of August.
Stock Market Outlook: SPX Closing Chart For Thu Aug 22 2024
The index closed above all the major moving averages on Thursday which is bullish.
The closing candlestick is bearish and signals that weakness should be expected for Friday.
The 21 day moving average is turning higher and but will not cross above the 50 day this week. This is bearish.
The 50 day moving average is rising and closed at 5483. This is bullish.
The 100 day moving average is rising and closed at 5339 which is bullish.
The 200 day moving average is in an uptrend and closed at 5116 which is bullish.
The Lower Bollinger Band is below the 100 day moving average and has turned lower which is bullish.
The Upper Bollinger Band is moving higher which is also bullish.
The S&P chart is strongly bullish but the closing candlestick is bearish for Friday.
SPX Stock Market Outlook review of Thu Aug 22 2024
Stock Market Outlook: Technical Indicators Review
Momentum: Momentum is falling and positive. It is overbought.
|
MACD Histogram: MACD (Moving Averages Convergence / Divergence) issued an up signal on Wed Aug 14 2024. On Thu Aug 22 2024 the up signal lost strength which is readily seen in the histogram.
|
Ultimate Oscillator: The Ultimate Oscillator is falling and positive. It is no longer overbought.
|
Slow Stochastic: The Slow Stochastic has a down signal in place. It is overbought.
|
Relative Strength Index: The RSI signal is falling and positive. It is not overbought.
|
Rate of Change: The rate of change signal is rising signaling Friday will end higher.
|
Stock Market Outlook: Support and Resistance Levels |
| 5660 is resistance |
| 5650 is resistance |
| 5625 is resistance |
| 5615 is resistance |
| 5600 is resistance |
| 5575 is resistance |
| 5550 is resistance |
| 5540 is resistance |
| 5525 is resistance |
| 5500 is resistance |
| 5470 is resistance |
| 5450 is resistance |
| 5425 is resistance |
| 5400 is support |
| 5375 is support |
| 5350 is support |
| 5325 is support |
| 5300 is support |
| 5275 is support |
| 5250 is support |
| 5225 is support |
| 5200 is support |
Stock Market Outlook for Fri Aug 23 2024
For Friday the technical indicators were hammered by Thursday’s sell-off. Signals have switch to bearish and are pointing lower for the SPX.
A lo of Friday’s market direction will depend on Fed Chair Powell. If his comments are perceived as supportive of a rate cut in September stocks could find their footing. If on the other hand he continues to take a wait and see approach beyond September, stocks will move lower.
Friday’s market action is All About The Fed.
Potential Economic and Political Market Moving Events
Monday:
10:00 Leading economic indicators are expected to drop from 0.2% to -0.4%. This will be in-line with analysts who expect a 50 basis point rate cut in September.
Tuesday:
No economic reports
Wednesday:
2:00 FOMC July minutes are released
Thursday:
8:30 Weekly Initial Unemployment Insurance Claims came in at 232,000 which was higher than estimated
9:45 Flash services PMI came in higher at 55.2
9:45 Flash manufacturing PMI was expected to come in at 50.5 but dropped to 48.0
10:00 Existing home sales came in as estimated at 3.95 million up from 3.89 million.
Friday:
10:00 Fed Chair Powell speech at Jackson Hole
10:00 New home sales are expected to rise to 620,000 for July.