

Thursday saw stocks move higher in a broad-based rally, following news of China possibly coming to the negotiation table over the tariff issue and France stepping in to assist Turkey. Stock rose higher with the Dow gaining the most adding 396 points. The NASDAQ gained the least.
Stock Market Outlook Chart Comments At The Close on Thu Aug 16 2018
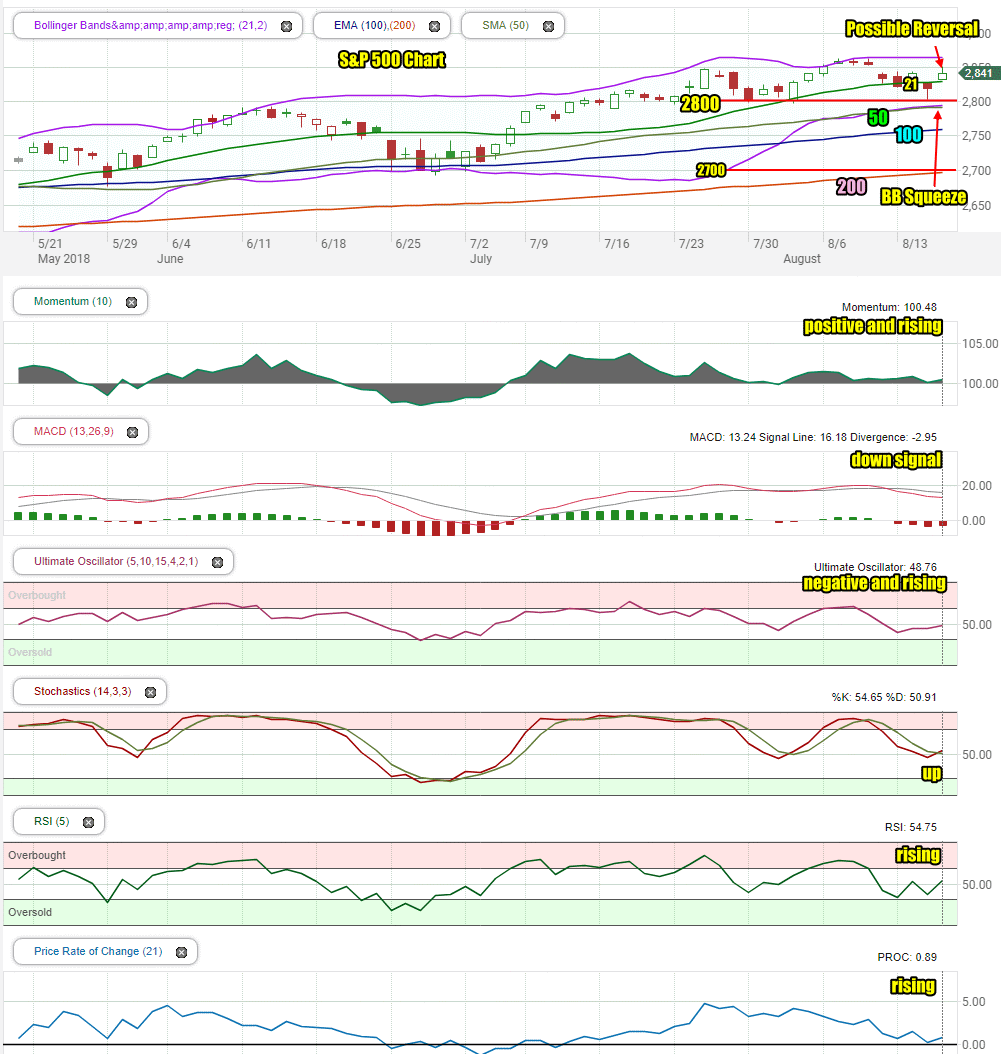
The S&P ended the day back above the 21 day moving average. The rally left behind a candlestick that advises that the market rose higher but failed to close on the highs. Often this is seen as a potential reversal but almost as often it is followed by a day when the index goes nowhere with any strength. Almost a neutral outlook.
All the major moving averages are still climbing and the Bollinger Bands Squeeze is starting to try to turn higher. The 21 day moving average is also trying to turn higher.
Stock Market Outlook review of Thu Aug 16 2018
Stock Market Outlook: Technical Indicators Review:
Momentum: For momentum I use a 10 period when studying market direction. Momentum is positive and rising.
MACD Histogram: For MACD Histogram, I am using the Fast Points set at 13, Slow Points at 26 and Smoothing at 9. MACD (Moving Averages Convergence / Divergence) issued a down signal on Mon Aug 13 2018. The down signal was stronger on Wednesday.
Ultimate Oscillator: The Ultimate Oscillator settings are: Period 1 is 5, Period 2 is 10, Period 3 is 15, Factor 1 is 4, Factor 2 is 2 and Factor 3 is 1. These are not the default settings but are the settings I use with the S&P 500 chart set for 1 to 3 months. The Ultimate Oscillator signal is negative and rising.
Slow Stochastic: For the Slow Stochastic I use the K period of 14 and D period of 3. The Slow Stochastic tries to predict the market direction further out than just one day. The Slow Stochastic has an up signal in place after today’s close.
Relative Strength Index: The relative strength index is set for a period of 5 which gives it 5 days of market movement to monitor. It is often the first indicator to show an overbought or oversold signal. The RSI signal is rising.
Rate of Change: Rate Of Change is set for a 21 period. This indicator looks back 21 days and compares price action from the past to the present. With the Rate Of Change, prices are rising when signals are positive. Conversely, prices are falling when signals are negative. As an advance rises the Rate Of Change signal should also rise higher, otherwise the rally is suspect. A decline should see the Rate Of Change fall into negative signals. The more negative the signals the stronger the decline. The rate of change signal is rising.
Support Levels To Be Aware Of:
2795 is light support
2745 to 2750 is light support
2725 is light support.
2700 is support.
2675 is light support.
2650 is light support
2620 is light support
2600 is strong support.
There is good support at the 2550 level from where the market bounced back from the recent correction low on Feb 9.
The S&P has light support at 2480. It also has light support at 2450 and good support at 2425. Below that there is some support at 2400, 2380, 2350. 2300 has the most support at present but would represent a full correction as a drop to this level would be 20% and just 5% away from a potential bear market signal.
Stock Market Outlook for Tomorrow – Fri Aug 17 2018
The technical indicators on Thursday look better than they did on Wednesday at the close. All the indicators have risen and are pointing higher except for MACD which still has a sell signal in place on the stock index.
I am expecting a very choppy day of trading on Friday. The NASDAQ is probably going to head lower as it is dragged down by the semi-conductor sector on Friday. This will impact the S&P. Large dips though are going to be traded. I will be buying SPY calls on large dips on Friday.
The day will see a lot of weakness, especially early morning and mid-afternoon. The close though looks positive but only slightly.
Stock Market Outlook Archives
Stock Market Outlook For Wed May 6 2026 – Choppy But Higher Still

Morning Investing Strategy Notes for Tue May 5 2026

Stock Market Outlook For Tue May 5 2026 – Overbought and Lower

Morning Investing Strategy Notes for Mon May 4 2026
Stock Market Outlook For Mon May 4 2026 – Dips Likely With Possible Lower Close

Morning Investing Strategy Notes for Fri May 1 2026
Stock Market Outlook For Fri May 1 2026 – Overbought But Higher

Morning Investing Strategy Notes for Thu Apr 30 2026
Stock Market Outlook For Thu Apr 30 2026 – Dips Likely Possible Lower Close
Morning Investing Strategy Notes for Wed Apr 29 2026
Stock Market Outlook For Wed Apr 29 2026 – Choppy But Higher Ahead Of More Earnings

Morning Investing Strategy Notes for Tue Apr 28 2026