
 Prior Trading Day Summary
On Thu Aug 14 2025 the Producer Price Index numbers were higher than estimated. Analysts worry that tariffs are starting to impact inflation. The PPI rose to 0.9% up from 0.0% prior. Core PPI rose to 0.6% but PPI year-over-year rose to 3.3% from 2.3%. Many analysts changed their outlook for a Fed rate cut in September and that sent stocks lower. It was a choppy day for stocks but investors continued to pick through stocks and the closes were actually quite good, considering the shock the PPI numbers gave investors initially.
The S&P recovered its footing and closed up 2 points.
The NASDAQ also recovered to close down just 2 points.
Lets review the closing technical indicators from Thu Aug 14 2025 to see what they predict for Fri Aug 15 2025.
Stock Market Outlook: SPX Closing Chart For Thu Aug 14 2025
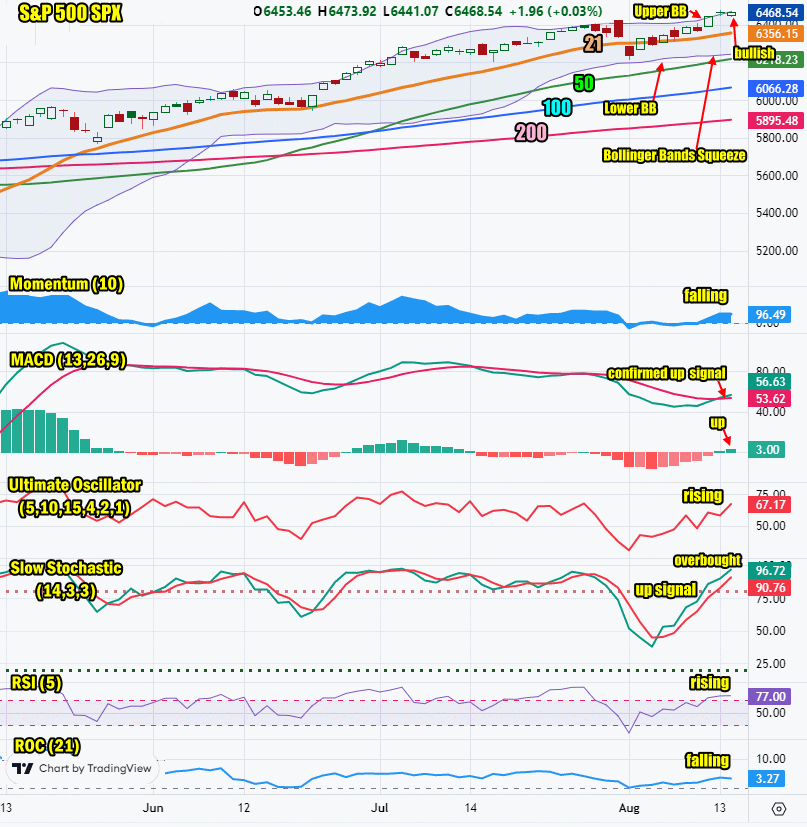
The index closed above the 21 day moving average and above the Upper Bollinger Band. This is bullish.
The closing candlestick is bullish for Friday but with shadows indicating the index is overbought.
The 21 day moving average is rising and closed at 6356 which is bullish.
The 50 day moving average is rising and closed at 6218 which is bullish.
The 100 day moving average is rising and closed at 6066 which is bullish.
The 200 day moving average is rising and closed at 5895 which is bullish.
The Lower Bollinger Band is turning lower which is bullish. The Upper Bollinger Band is moving higher which is bullish. The Bollinger Bands Squeeze is ending and stocks still are positioned to move higher out of the squeeze but with the index overbought, we could see some weakness, especially next week.
The SPX chart is more bullish than bearish for Friday but there are some warnings signals.
SPX Stock Market Outlook review of Thu Aug 14 2025
Stock Market Outlook: Technical Indicators Review
Momentum: Momentum is falling and positive.
|
MACD Histogram: MACD (Moving Averages Convergence / Divergence) issued an up signal on Wed Aug 13 2025. On Thu Aug 14 2025 the up signal was confirmed.
|
Ultimate Oscillator: The Ultimate Oscillator is rising.
|
Slow Stochastic: The Slow Stochastic has an up signal in place and now overbought.
|
Relative Strength Index: The RSI signal is rising.
|
| Rate of Change: The rate of change signal is falling signaling a lower close for Friday. Settings: Rate Of Change is set for a 21 period. This indicator looks back 21 days and compares price action from the past to the present. With the Rate Of Change, prices are rising when signals are positive. Conversely, prices are falling when signals are negative. As an advance rises, the Rate Of Change signal should also rise higher, otherwise the rally is suspect. A decline should see the Rate Of Change fall into negative signals. The more negative the signals the stronger the decline. |
Stock Market Outlook: Support and Resistance Levels |
| 6470 is resistance |
| 6450 is resistance |
| 6425 is resistance |
| 6400 is resistance |
| 6390 is resistance |
| 6365 is resistance |
| 6350 is resistance |
| 6325 is resistance |
| 6300 is resistance |
| 6250 is resistance |
| 6225 is resistance |
| 6200 is resistance |
| 6175 is support |
| 6150 is support |
| 6125 is support |
| 6100 is support |
| 6075 is support |
| 6050 is support |
| 6025 is support |
| 6000 is support |
Stock Market Outlook for Fri Aug 15 2025
For Friday stocks are positioned to open slightly lower but under some selling pressure. With President Trump meeting with Russian President Putin today, many investors will be in a holding pattern while waiting for news of the talks to end the Ukraine-Russia conflict.
Meanwhile news on Intel has the stock higher after hours with rumors that the Government could take a position in the company. Intel did not comment on the rumors. The stock rose during the day on Thursday. We may see more upside today.
With stocks entering overbought signals, Friday may be a tough day for stocks to make new closing highs but the overall outlook is still bullish.
Potential Economic and Political Market Moving Events
Monday:
No reports
Tuesday:
6:00 NFIB Optimism index rose to 100.3, well above estimates
8:30 Consumer Price Index for July is fell to 0.2% from 0.3% prior
8:30 CPI year-over-year stayed at 2.7% unchanged
8:30 Core CPI rose as estimated to 0.3%
8:30 Core CPI year-over-year rose to 3.1% as estimated, above 2.9% prior
Wednesday:
No economic reports but 3 Fed Presidents speak throughout the day. We may hear more about rate cuts which will support stocks.
Thursday:
8:30 Weekly Initial Unemployment Insurance Claims were lower than estimated at 224,000
8:30 Producer Price Index for July rise unexpectedly to 0.9%
8:30 Core PPI is rose above estimates to 0.6%
8:30 PPI year-over-yearjumped to 3.3%, well beyond estimates
8:30 Core PPI year-over-year rose more than estimated, to 2.8%
Friday:
8:30 Retail sales are estimated to fall 0.5% from 0.6% prior
8:30 empire State manufacturing index is estimated to fall to 1.8 from 5.5
8:30 Import price index is estimated to slip to 0.0% from 0.1%
9:15 Industrial production is estimated to be flat at 0.0% from 0.3% prior
9:15 Capacity Utilization is estimated unchanged at 77.6%
10:00 Business inventories are estimated to rise to 0.2% from 0.0% prior
10:00 Consumer sentiment is estimated to rise to 62.5% from 61.7% prior