

Day’s Summary
On Thursday the latest CPI numbers supported the outlook that inflation was slowing and the Fed might be winning the inflation battle. Year-over-year the CPI came in at 3.2% with core CPI at 4.7%. Stocks opened higher with the SPX above 4530. As the day wore on though, sellers still dominated and the gains were slowly eroded intraday. By the close the S&P was up just 1 points to 4468.
The NASDAQ gained 16 points to end the day at 13,738.
Let’s review the technical indicators from the close on Thursday to see what to expect for the final trading day this week.
Stock Market Outlook: SPX Closing Chart For Thu Aug 10 2023
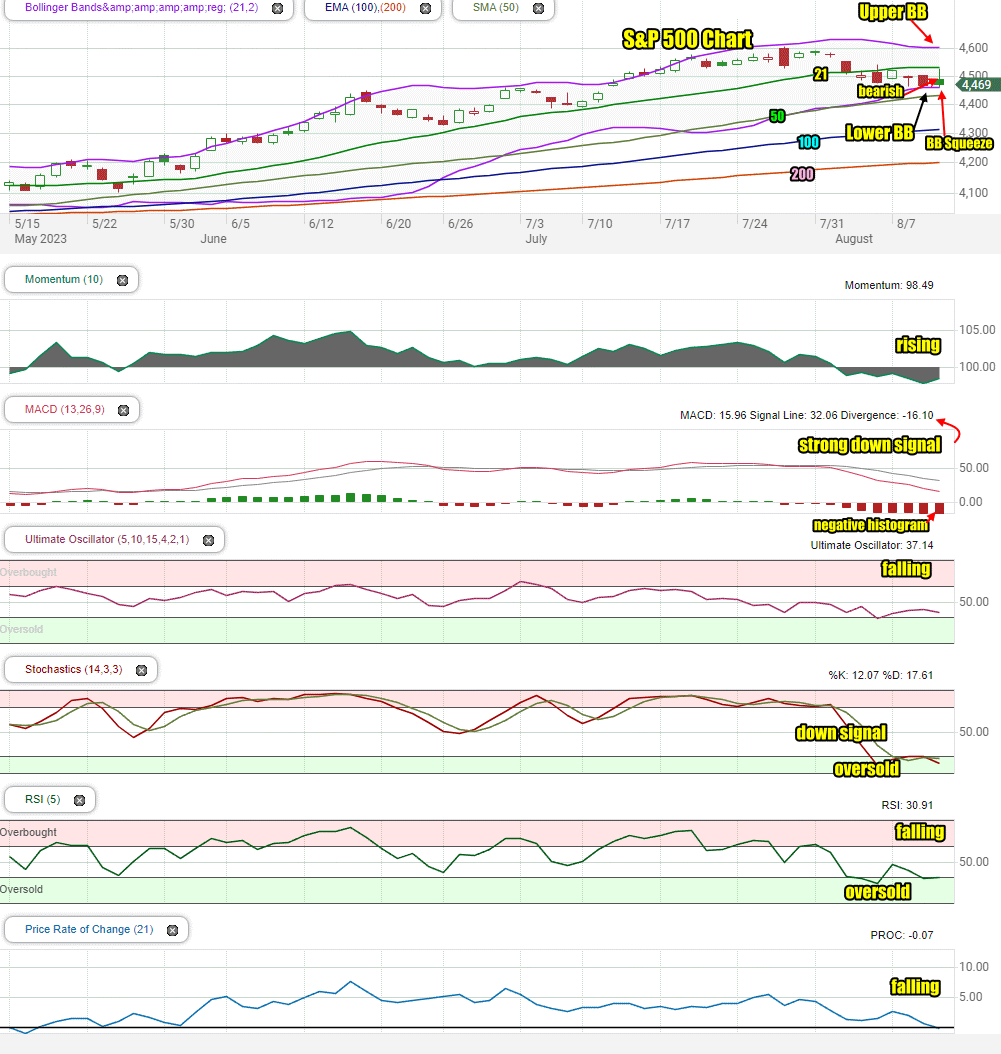
The index closed below the 21 day moving average for a sixth day. This is bearish.
The closing candlestick on Thursday is bearish but also signaling stocks are deeply oversold.
The 21 day moving average is turned sideways. The 50, 100 and 200 day moving averages are continuing to climb which is bullish.
The Lower Bollinger Band fell slightly but is still bearish. The Upper Bollinger Band is turning sideways which could be signaling a potential bounce. A new Bollinger Bands Squeeze is underway. At present the squeeze looks like stocks will move lower but often stocks actually dip and then recover to move higher.
Stock Market Outlook review of Thu Aug 10 2023
Stock Market Outlook: Technical Indicators Review
Momentum: Momentum is rising and negative. It is signaling oversold.
|
MACD Histogram: MACD (Moving Averages Convergence / Divergence) issued a down signal on Thursday Jul 27. On Thu Aug 10 2023 the down signal increased in strength. It is at a level where often we will see a strong bounce.
|
Ultimate Oscillator: The Ultimate Oscillator is falling, negative and trying to bounce from oversold.
|
Slow Stochastic: The Slow Stochastic has a down signal in place. It is oversold and signaling there is a chance for a bounce attempt coming.
|
Relative Strength Index: The RSI signal is falling and negative. It is back oversold.
|
Rate of Change: The rate of change signal is falling and near levels where often the index is deeply oversold.
|
Stock Market Outlook: Support and Resistance Levels |
| 4600 is resistance |
| 4575 is resistance |
| 4550 is resistance |
| 4525 is resistance |
| 4500 is support |
| 4485 is support |
| 4470 is support |
| 4450 is support |
| 4435 is support |
| 4420 is support |
| 4400 is support |
| 4390 is support |
| 4370 is support |
| 4350 is support |
| 4340 is support |
| 4325 is support |
| 4310 is support |
| 4300 is support |
| 4290 is support |
| 4275 is support |
| 4250 is support |
| 4240 is support |
| 4225 is support |
| 4210 is support |
| 4200 is good support |
Stock Market Outlook for Fri Aug 11 2023
For Friday the technical indicators are pointing to another lower day but with a chance for a bounce still in the background. Stocks are very oversold and with the CPI numbers now out, investors may try to bounce stocks higher. That though is not the outlook for Friday. A lower day is expected.
Potential Economic and Political Market Moving Events
The big event this week was the latest CPI numbers yesterday.
Friday:
8:30 Producer Price Index
8:30 Core PPI and PPI year over year
10:00 Consumer sentiment