

The rally on Thursday was more what I had expected for Wednesday, a higher rally that fails and erodes and closes slightly negative.
However Thursday’s rally was lost as a result of a leaked report on Gilead’s anti-coronavirus drug remdesivir out of China indicating that the product did not work. That sent Gilead Sciences Stock (GILD) lower but blew the wind out of the rally and shut it down.
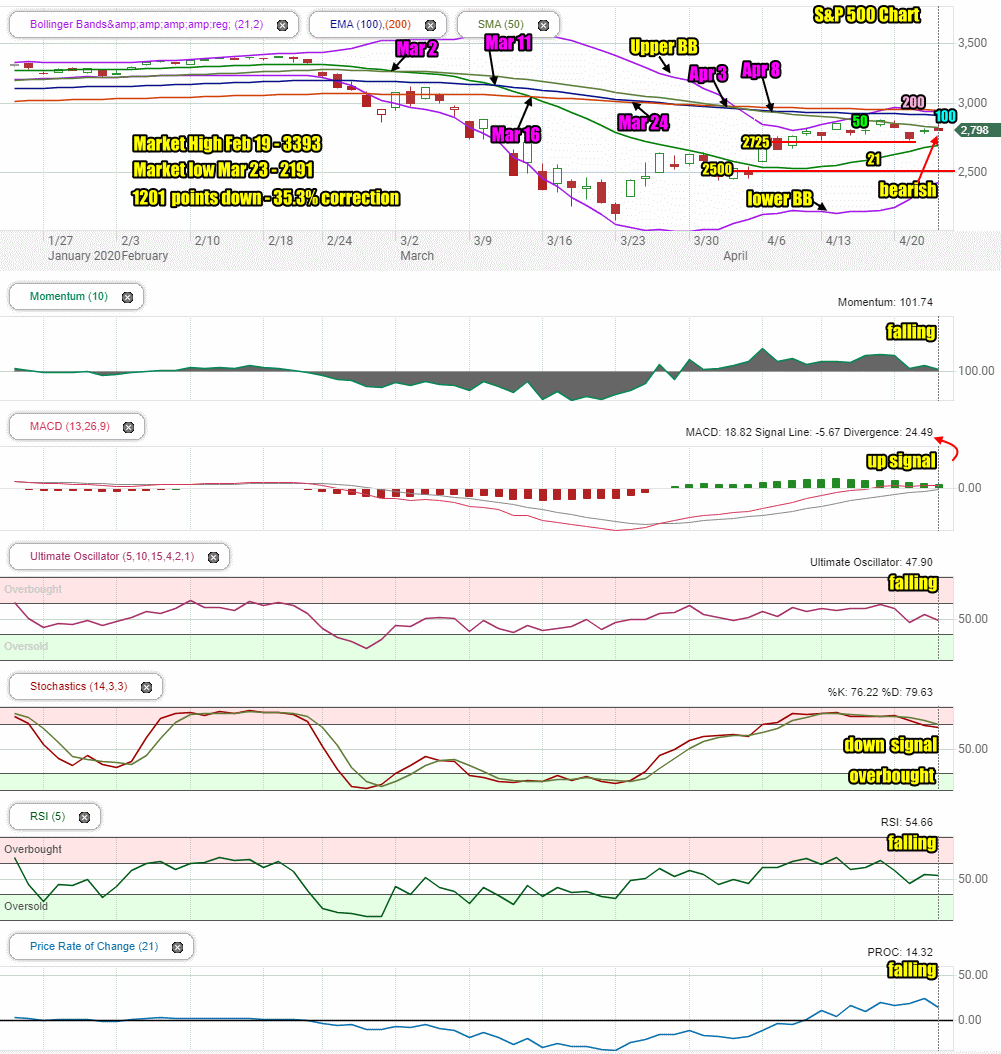
Stock Market Outlook Chart Comments At The Close on Wed Apr 22 2020
The SPX chart continues to be bearish with 6 sell signals in the chart. On Thursday the index closed once again almost at 2800. The chart on Wednesday had been bearish and even without the Gilead’s anti-coronavirus drug remdesivir report being leaked the market was weak during the morning and showed signs of failing.
The 200 day moving average is still leading the market, which is typical in a bear market. It is followed by the 100 day and the 50 day. The 50 day is falling quickly. The 21 day is turning back up which if it could continue to climb would be good for the bulls, but for now, this looks like a bounce in that moving average.
The closing candlestick on Thursday is bearish for Friday. At present the Upper Bollinger Band is starting to fall back toward the Lower Bollinger Band which could set the index up for another Bollinger Bands Squeeze. This one might see stocks move lower. We should see a squeeze early next week.
Stock Market Outlook review of Thu Apr 23 2020
Stock Market Outlook: Technical Indicators Review:
Momentum: Momentum is falling and still positive.
- Settings: For momentum I use a 10 period when studying market direction.
MACD Histogram: MACD (Moving Averages Convergence / Divergence) issued an up signal on Thursday March 26. The up signal is weaker again today.
- Settings: For MACD Histogram, I am using the Fast Points set at 13, Slow Points at 26 and Smoothing at 9.
Ultimate Oscillator: The Ultimate Oscillator signal is falling and negative.
- Settings: The Ultimate Oscillator settings are: Period 1 is 5, Period 2 is 10, Period 3 is 15, Factor 1 is 4, Factor 2 is 2 and Factor 3 is 1. These are not the default settings but are the settings I use with the S&P 500 chart set for 1 to 3 months.
Slow Stochastic: The Slow Stochastic has a down signal in place for a third day and is signaling overbought.
- Settings: For the Slow Stochastic I use the K period of 14 and D period of 3. The Slow Stochastic tries to predict the market direction further out than just one day.
Relative Strength Index: The RSI signal is falling..
- Settings: The relative strength index is set for a period of 5 which gives it 5 days of market movement to monitor. It is often the first indicator to show an overbought or oversold signal.
Rate of Change: The rate of change signal is also falling pointing to lower prices ahead for stocks.
- Settings: Rate Of Change is set for a 21 period. This indicator looks back 21 days and compares price action from the past to the present. With the Rate Of Change, prices are rising when signals are positive. Conversely, prices are falling when signals are negative. As an advance rises the Rate Of Change signal should also rise higher, otherwise the rally is suspect. A decline should see the Rate Of Change fall into negative signals. The more negative the signals the stronger the decline.
Support and Resistance Levels To Be Aware Of:
2900 is resistance
2860 is resistance
2840 is resistance
2800 is resistance
2700 is light support and marked a drop of 20.4%.
2675 is light resistant
2650 is light support
2625 is light support
2600 is support
2550 is light support
2500 was good support and marked a correction of 26.3%
2344 is the next level of support and marks a 30.9% correction.
2191 was the market low on March 23 and most analysts believe this is the low point we will see.
2100 is light support
2000 is good support and marks a drop of 1393 points for a 41% correction. Some analysts believe the index will fall this low before the bear market ends.
Stock Market Outlook for Tomorrow – Fri Apr 24 2020
For Friday, the technical indicators are all shifting to pointing to the downside. A move back to a light support level at 2725 would not be unusual.
Overall the rally looks tired and ready to move back to find better support. 2800 has been tough to break through and stay above. That’s primarily because stocks are overvalued above 2800 and sellers are sitting at that level and continually taking profits. Until the COVID-19 pandemic dissipates the index will not be able to break much above 2850 or 2860. On Friday we will see it dip back as it looks for support.
Stock Market Outlook Archives
Stock Market Outlook For Wed May 6 2026 – Choppy But Higher Still

Morning Investing Strategy Notes for Tue May 5 2026

Stock Market Outlook For Tue May 5 2026 – Overbought and Lower

Morning Investing Strategy Notes for Mon May 4 2026
Stock Market Outlook For Mon May 4 2026 – Dips Likely With Possible Lower Close

Morning Investing Strategy Notes for Fri May 1 2026
Stock Market Outlook For Fri May 1 2026 – Overbought But Higher

Morning Investing Strategy Notes for Thu Apr 30 2026
Stock Market Outlook For Thu Apr 30 2026 – Dips Likely Possible Lower Close
Morning Investing Strategy Notes for Wed Apr 29 2026
Stock Market Outlook For Wed Apr 29 2026 – Choppy But Higher Ahead Of More Earnings

Morning Investing Strategy Notes for Tue Apr 28 2026