
 What Happened On Wed Feb 7 2018
I would love to say that Wednesday’s close looked promising but it didn’t. The Dow Jones Industrial Average and the S&P 500 both gave up their biggest point leads in about three years. The Dow boasted an intraday advance of 381 points, but ended the down 19 points. Much of the selling erupted when 10 year treasury yields rose in the afternoon.
Closing Statistics for Wed Feb 7 2018
S&P 500 Index Close
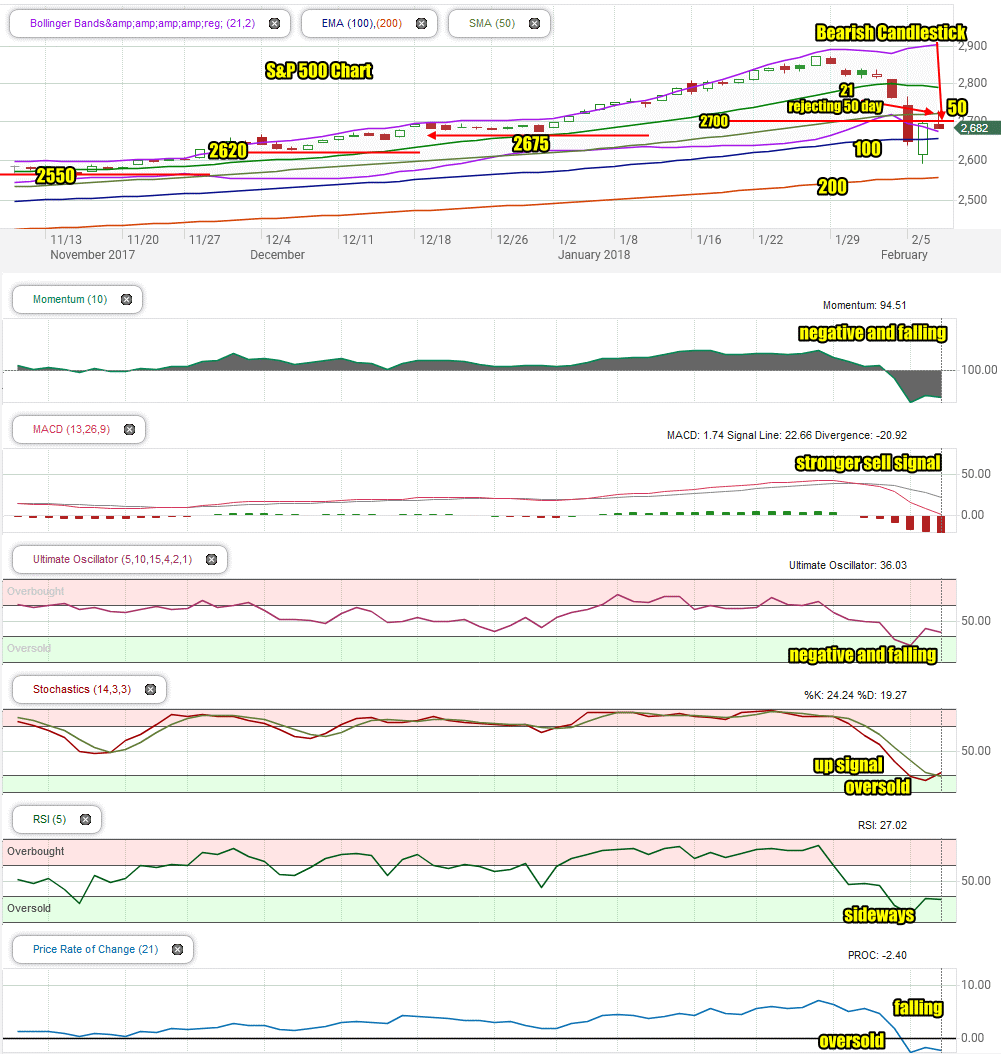
The S&P index ended down 13.48 to 2681.66
Dow Jones Index Close
The Dow Jones ended down 19.42 to 24,893.35
NASDAQ Index Close
The NASDAQ closed down 63.90 to 7051.98
Stock Market Outlook – Review of Wed Feb 7 2018
Chart Comments At The Close:
Wednesday saw the rally in the S&P rejected at the 50 day moving average. Repeated attempts were met by waves of selling. In the afternoon when 10 year Treasury yields rose, the S&P gave up the rally attempt and began to move lower. The close was met by strong selling but the index held up surprisingly well in face of large sell volumes.
We need to keep watching the Upper Bollinger Band for any sign that it is turning down. That will be bearish at this point in the recovery attempt. The close on Wednesday left behind a bearish candlestick. The 50 day moving average is starting to turn down. The 21 day moving average has a more pronounced pullback underway. The 100 day and 200 day moving averages are still climbing which is bullish.
Stock Market Outlook review of Wed Feb 7 2018
Stock Market Outlook: Technical Indicators:
Momentum: For momentum I use a 10 period when studying market direction. Momentum is negative and falling back.
MACD Histogram: For MACD Histogram, I am using the Fast Points set at 13, Slow Points at 26 and Smoothing at 9. MACD (Moving Averages Convergence / Divergence) issued a sell signal on Jan 31. On Feb 7 the sell signal was stronger again despite the rally attempt.
Ultimate Oscillator: The Ultimate Oscillator settings are: Period 1 is 5, Period 2 is 10, Period 3 is 15, Factor 1 is 4, Factor 2 is 2 and Factor 3 is 1. These are not the default settings but are the settings I use with the S&P 500 chart set for 1 to 3 months. The Ultimate Oscillator signal is negative and falling back.
Slow Stochastic: For the Slow Stochastic I use the K period of 14 and D period of 3. The Slow Stochastic tries to predict the market direction further out than just one day. The Slow Stochastic has an up signal in place for Thursday, the first up signal in just over a week.
Relative Strength Index: The relative strength index is set for a period of 5 which gives it 5 days of market movement to monitor. It often is the first indicator to show an overbought or oversold signal. The RSI signal is moving sideways.
Rate of Change: Rate Of Change is set for a 21 period. This indicator looks back 21 days and compares price action from the past to the present. The rate of change signal is back falling and is oversold.
Support Levels To Be Aware Of:
2700-2710 is at present the 50 day moving average. It is not support but often these technical indicators can slow or reverse a sell-off.
2675 and 2620 are light support.
There is good support at the 2550 level.
The S&P has light support at 2480. It also has light support at 2450 and good support at 2425. Below that there is some support at 2400, 2380, 2350. 2300 has the most support at present but would represent a full correction as a drop to this level would be almost 15%.
Stock Market Outlook for Tomorrow – Thu Feb 8 2018
The loss of the rally on Wednesday will probably see stocks open lower on Thursday. That could lead to another rally attempt but overall the technical indicators are pulling back, pointing down and advising the S&P will move lower in a choppy session. Only the Slow Stochastic is holding a new up signal, however it looks out more than a day so it could be advising that we will see the market move higher shortly.
For Thursday the outlook is lower but it will be another volatile session.
Market Direction Internal Links
Profiting From Understanding Market Direction (Articles Index)
Understanding Short-Term Signals
Market Direction Portfolio Trades (Members)
Market Direction External Links
IWM ETF Russell 2000 Fund Info
Market Direction SPY ETF 500 Fund Info