

With word that the coronavirus seemed to be slowing and contained with fewer deaths than expected, investors jumped into stocks for a second day and sent them roaring higher.
By the close, indexes had recovered all the losses from the latest pullback. The NASDAQ made another new intraday and closing all-time high on Tuesday.
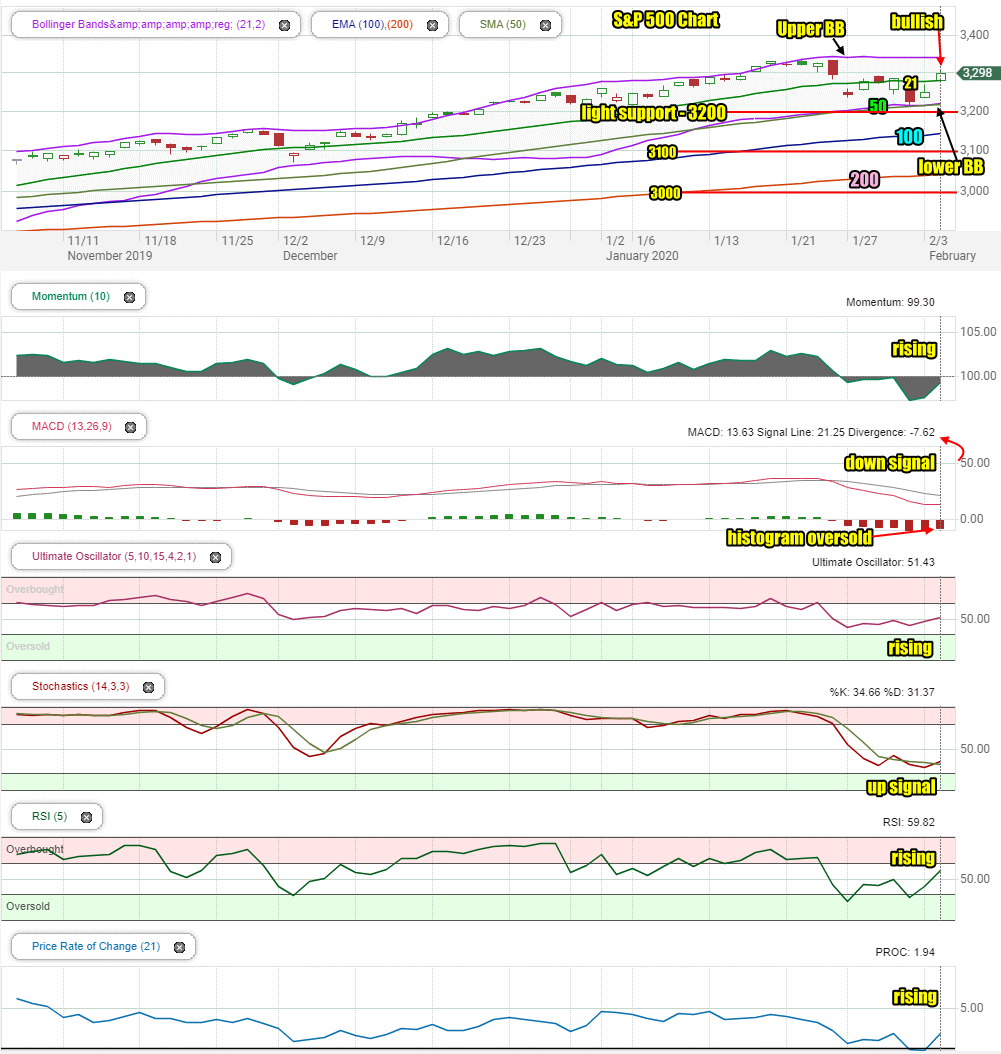
Stock Market Outlook Chart Comments At The Close on Tue Feb 4 2020
The SPX chart is still bearish as it will take more than a day or two to turn the chart from bearish to bullish however the outlook has improved.
The closing candlestick on Tuesday is bullish for Wednesday although often, this candlestick also signals a day of weakness to come.
The bounce pushed above the 21 day moving average and closed above it. We should see the index try to hold this moving average on Wednesday.
The Bollinger Bands are still working their way into a potential Bollinger Bands Squeeze. The 21, 50 and 100 day moving averages are starting to turn lower. Only the 200 day is still climbing.
There are four support levels in place. These are light support at 3200 which may get tested as early as Tuesday, 3100 which is a full 100 points lower, 3075 which is light support and 3000 which is major support.
Stock Market Outlook review of Tue Feb 4 2020
Stock Market Outlook: Technical Indicators Review:
Momentum: Momentum is negative and rose on Tuesday.
- Settings: For momentum I use a 10 period when studying market direction.
MACD Histogram: MACD (Moving Averages Convergence / Divergence) issued a down signal on Friday Jan 24. At the close on Tuesday the sell signal was still strong. The MACD histogram shows the market as oversold. It is rising which signals that the market should move higher on Wednesday.
- Settings: For MACD Histogram, I am using the Fast Points set at 13, Slow Points at 26 and Smoothing at 9.
Ultimate Oscillator: The Ultimate Oscillator signal is rising.
- Settings: The Ultimate Oscillator settings are: Period 1 is 5, Period 2 is 10, Period 3 is 15, Factor 1 is 4, Factor 2 is 2 and Factor 3 is 1. These are not the default settings but are the settings I use with the S&P 500 chart set for 1 to 3 months.
Slow Stochastic: The Slow Stochastic has an up signal in place for Wednesday.
- Settings: For the Slow Stochastic I use the K period of 14 and D period of 3. The Slow Stochastic tries to predict the market direction further out than just one day.
Relative Strength Index: The RSI signal is rising.
- Settings: The relative strength index is set for a period of 5 which gives it 5 days of market movement to monitor. It is often the first indicator to show an overbought or oversold signal.
Rate of Change: The rate of change signal is rising and is no longer oversold.
- Settings: Rate Of Change is set for a 21 period. This indicator looks back 21 days and compares price action from the past to the present. With the Rate Of Change, prices are rising when signals are positive. Conversely, prices are falling when signals are negative. As an advance rises the Rate Of Change signal should also rise higher, otherwise the rally is suspect. A decline should see the Rate Of Change fall into negative signals. The more negative the signals the stronger the decline.
Support and Resistance Levels To Be Aware Of:
3325 is resistance
3200 is light support
3100 is light support
3075 is light support
3030 is very light support
3000 is good support and if the S&P fell this low it would mark a normal correction in a bull market
2960 is light support
2900 is light support
2860 is light support
2840 is good support
2800 is strong support
Stock Market Outlook for Tomorrow – Wed Feb 5 2020
Technically, a bounce such as we saw on Tuesday will be followed by a weak morning but a higher close is still expected as there is enough momentum to push the index higher. Even a negative close would not be unexpected following the rally as the bias has shifted back to up, once again.
Stock Market Outlook Archives
Stock Market Outlook For Wed May 6 2026 – Choppy But Higher Still

Morning Investing Strategy Notes for Tue May 5 2026

Stock Market Outlook For Tue May 5 2026 – Overbought and Lower

Morning Investing Strategy Notes for Mon May 4 2026
Stock Market Outlook For Mon May 4 2026 – Dips Likely With Possible Lower Close

Morning Investing Strategy Notes for Fri May 1 2026
Stock Market Outlook For Fri May 1 2026 – Overbought But Higher

Morning Investing Strategy Notes for Thu Apr 30 2026
Stock Market Outlook For Thu Apr 30 2026 – Dips Likely Possible Lower Close
Morning Investing Strategy Notes for Wed Apr 29 2026
Stock Market Outlook For Wed Apr 29 2026 – Choppy But Higher Ahead Of More Earnings

Morning Investing Strategy Notes for Tue Apr 28 2026