
 On Monday Feb 27 2017, we saw the indexes trade once in a choppy session. Stock indexes fluctuated into negative readings but by the close they had regained their footing and moved slightly higher. Only the Dow Jones and S&P set new highs. The NASDAQ came within a few points. Tuesday evening President Trump has a joint address to Congress, which may impact stocks on Wednesday.
Let’s look at the closings on Monday and then take a technical overview to see if we can judge where Tuesday will end up.
S&P Index Close
The S&P index ended the day up just 2.41 points to close at 2369.75 for another record close.
Dow Jones Index Close
The Dow Jones ended up 15.68 points to close at 20,837.44 after setting a new intraday high today.
NASDAQ Index Close
The NASDAQ closed up 16.59 points to end the day at 5,861.90 near its all-time high.
Stock Market Outlook
Stock Market Outlook review of Monday Feb 27 2017
Chart Comments At The Close:
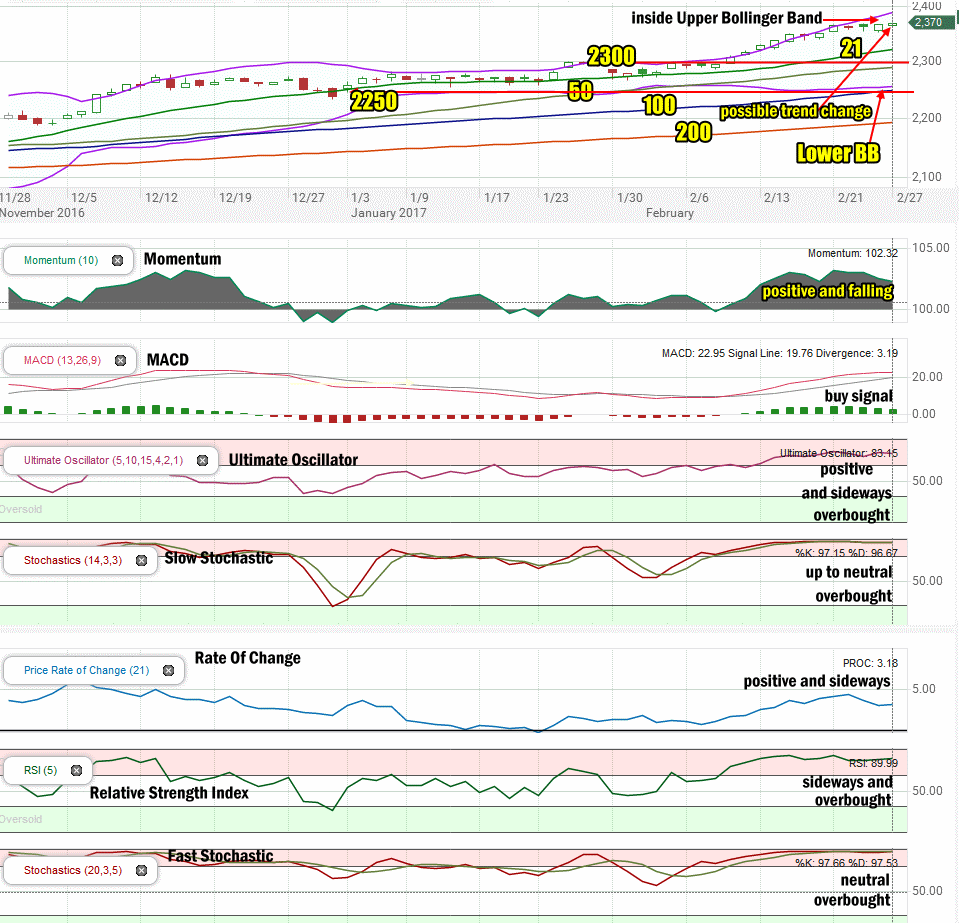
On Monday the S&P trended sideways below the Upper Bollinger Band. The close today left behind a possible reversal candlestick which often signals a potential change in trend. This sometimes takes a day or two to play out. This is the second such negative candlestick in the past three trading days. In a sideways market it is not uncommon to get many of these bearish type candlesticks without an actual bearish day happening but its worth keeping an eye out just in case.
The Lower Bollinger Band which I indicated last week had stopped falling and was moving back up, is now back falling which is bullish.
The major moving averages are all still climbing which is bullish.
Stock Market Outlook: Technical Indicators:
Momentum: For momentum I use a 10 period when studying market direction. Momentum is positive and is falling back but still quite strongly positive.
MACD Histogram: For MACD Histogram, I am using the Fast Points set at 13, Slow Points at 26 and Smoothing at 9. MACD (Moving Averages Convergence / Divergence) issued a buy signal Feb 10 2017. The buy signal continues into Tuesday’s open.
Ultimate Oscillator: The Ultimate Oscillator settings are: Period 1 is 5, Period 2 is 10, Period 3 is 15, Factor 1 is 4, Factor 2 is 2 and Factor 3 is 1. These are not the default settings but are the settings I use with the S&P 500 chart set for 1 to 3 months. The Ultimate Oscillator is positive and moving sideways . It is overbought. The sideways pattern indicates stocks are not predicted to fall.
Slow Stochastic: For the Slow Stochastic I use the K period of 14 and D period of 3. The Slow Stochastic tries to predict the market direction further out than just one day. The Slow Stochastic has an up to neutral signal in place and is overbought.
Rate of Change: Rate Of Change is set for a 21 period. This indicator looks back 21 days and compares price action from the past to the present. The rate of change signal is positive and moving sideways another signal that prices are not expected to change by much on Tuesday.
Relative Strength Index: The relative strength index is set for a period of 5 which gives it 5 days of market movement to monitor. It often is the first indicator to show an overbought or oversold signal. RSI is showing the market as extremely overbought and moving sideways, rather than down or up.
Fast Stochastic: For the Fast Stochastic I use the K period of 20 and D period of 5. These are not default settings, but settings I use for the 1 to 3 month S&P 500 chart when I have it set for daily views. The Fast Stochastic has a neutral signal in place and is also very overbought.
Support Levels To Be Aware Of:
The market has light support at the 2250 level. There is also light support at 2195 but better support is at 2180 and then 2150.
Stock Market Outlook for Tomorrow – Tuesday Feb 28 2017
The technical indicators on Monday are still very overbought but whereas on Thursday they were pointing lower for Friday, today they are pointing sideways for Tuesday.
Overall there are no signals pointing to a large dip being expected for Tuesday but instead the indicators are pointing to yet another day of sideways movement with a bias to the upside but in another choppy session.
Stay FullyInformed With Email Updates
Market Direction Internal Links
Profiting From Understanding Market Direction (Articles Index)
Understanding Short-Term Signals
Market Direction Portfolio Trades (Members)
Market Direction External Links
IWM ETF Russell 2000 Fund Info
Market Direction SPY ETF 500 Fund Info