

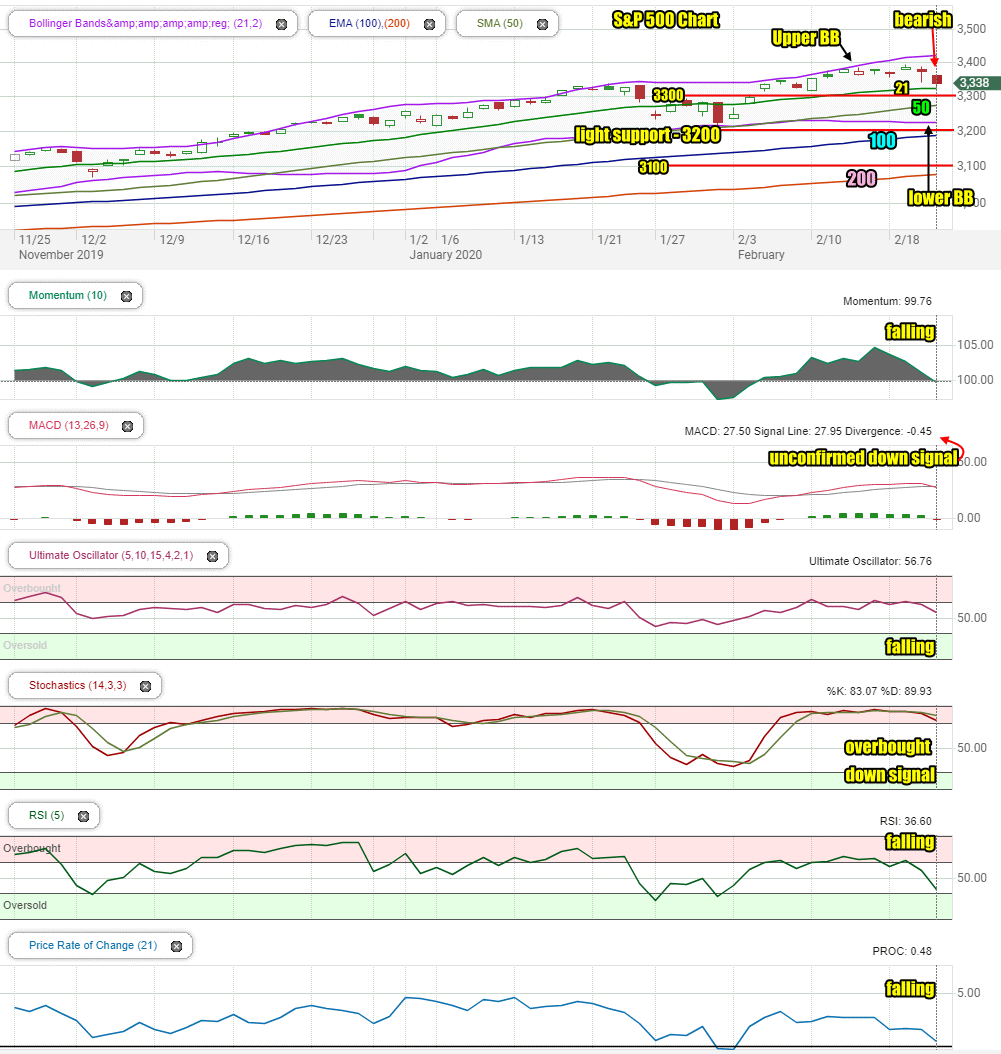
On Friday continuing fears of the spread of the coronavirus continued to plague markets. All 3 indexes closed lower on Friday with the S&P reaching the 21 day moving average intraday before bouncing slightly off it, to close just above it at 3337.75.
Stock Market Outlook Chart Comments At The Close on Fri Feb 21 2020
The SPX chart is turning bearish with the S&P now testing the 21 day moving average. The chance of it breaking below is high a it most likely will reach 3300 which is light support for the rally since Feb 5.
All the major moving averages are climbing and the 100 day is continuing to approach the 3200 support level and the 200 day is still moving to the 3100 support level. A move above those support levels at present is no longer expected.
There are still four support levels in place. These are light support at 3200, 3100 which is a full 100 points lower, 3075 which is light support and 3000 which is major support.
The next major dip in the index may try to find support around 3300. If that level was tested and held, it would signal a major move higher is still to come for the S&P. The chance of 3300 breaking however is growing, as the market deals with continuing worries about the financial impact of a spreading of the coronavirus.
Resistance to the rally is still at 3400.
Stock Market Outlook review of Fri Feb 21
Stock Market Outlook: Technical Indicators Review:
Momentum: Momentum is falling for a fourth day and turned negative by the close on Friday.
- Settings: For momentum I use a 10 period when studying market direction.
MACD Histogram: MACD (Moving Averages Convergence / Divergence) issued an up signal on Friday Feb 7. The up signal was gone on Friday and the signal was for a down move. It is unconfirmed.
- Settings: For MACD Histogram, I am using the Fast Points set at 13, Slow Points at 26 and Smoothing at 9.
Ultimate Oscillator: The Ultimate Oscillator signal is falling indicating more weakness lies ahead.
- Settings: The Ultimate Oscillator settings are: Period 1 is 5, Period 2 is 10, Period 3 is 15, Factor 1 is 4, Factor 2 is 2 and Factor 3 is 1. These are not the default settings but are the settings I use with the S&P 500 chart set for 1 to 3 months.
Slow Stochastic: The Slow Stochastic has a down signal in place for Monday and is falling away from being overbought.
- Settings: For the Slow Stochastic I use the K period of 14 and D period of 3. The Slow Stochastic tries to predict the market direction further out than just one day.
Relative Strength Index: The RSI signal is falling rapidly.
- Settings: The relative strength index is set for a period of 5 which gives it 5 days of market movement to monitor. It is often the first indicator to show an overbought or oversold signal.
Rate of Change: The rate of change signal is also falling indicating lower prices are ahead.
- Settings: Rate Of Change is set for a 21 period. This indicator looks back 21 days and compares price action from the past to the present. With the Rate Of Change, prices are rising when signals are positive. Conversely, prices are falling when signals are negative. As an advance rises the Rate Of Change signal should also rise higher, otherwise the rally is suspect. A decline should see the Rate Of Change fall into negative signals. The more negative the signals the stronger the decline.
Support and Resistance Levels To Be Aware Of:
3400 is resistance
3200 is light support
3100 is light support
3075 is light support
3030 is very light support
3000 is good support and if the S&P fell this low it would mark a normal correction in a bull market
2960 is light support
2900 is light support
2860 is light support
2840 is good support
2800 is strong support
Stock Market Outlook for Tomorrow – Mon Feb 24 2020
For Monday we are dealing with an unconfirmed down signal from MACD. A lower close on Monday will setup the important technical indicator for a confirmed down signal the first down signal since Jan 24.
All the signals are moving lower indicating growing and continuing weakness.
The Relative Strength Index (RSI) and Rate Of Change signals are both falling quickly toward oversold signals. Another day or two of weakness could set up a potential bounce.
A lower day is expected for Monday and dips could be deeper at times. Positive news on the slowing and containment of the coronavirus would go a long way to firming up the market. Without any such news the market will test 3300 either Monday or Tuesday.
Stock Market Outlook Archives
Stock Market Outlook For Wed May 6 2026 – Choppy But Higher Still

Morning Investing Strategy Notes for Tue May 5 2026

Stock Market Outlook For Tue May 5 2026 – Overbought and Lower

Morning Investing Strategy Notes for Mon May 4 2026
Stock Market Outlook For Mon May 4 2026 – Dips Likely With Possible Lower Close

Morning Investing Strategy Notes for Fri May 1 2026
Stock Market Outlook For Fri May 1 2026 – Overbought But Higher

Morning Investing Strategy Notes for Thu Apr 30 2026
Stock Market Outlook For Thu Apr 30 2026 – Dips Likely Possible Lower Close
Morning Investing Strategy Notes for Wed Apr 29 2026
Stock Market Outlook For Wed Apr 29 2026 – Choppy But Higher Ahead Of More Earnings

Morning Investing Strategy Notes for Tue Apr 28 2026