

Stock Indexes on Thu Feb 13 2020 were once again small for the S&P and NASDAQ indexes. By the end of the day the S&P had made another new intraday high of 3385 and closed down just 5 points at 3373.94.
The NASDAQ also made a new intraday high of 9748 and closed down just 13.99 points at 9711.97.
The weakness was again a result of concerns over the coronavirus and how much the Chinese government could be trusted to give accurate numbers of both infections and the number of deaths. But dips throughout the day continued to find buyers, a sure sign the markets will move higher against shortly.
Stock Market Outlook Chart Comments At The Close on Thu Feb 13 2020
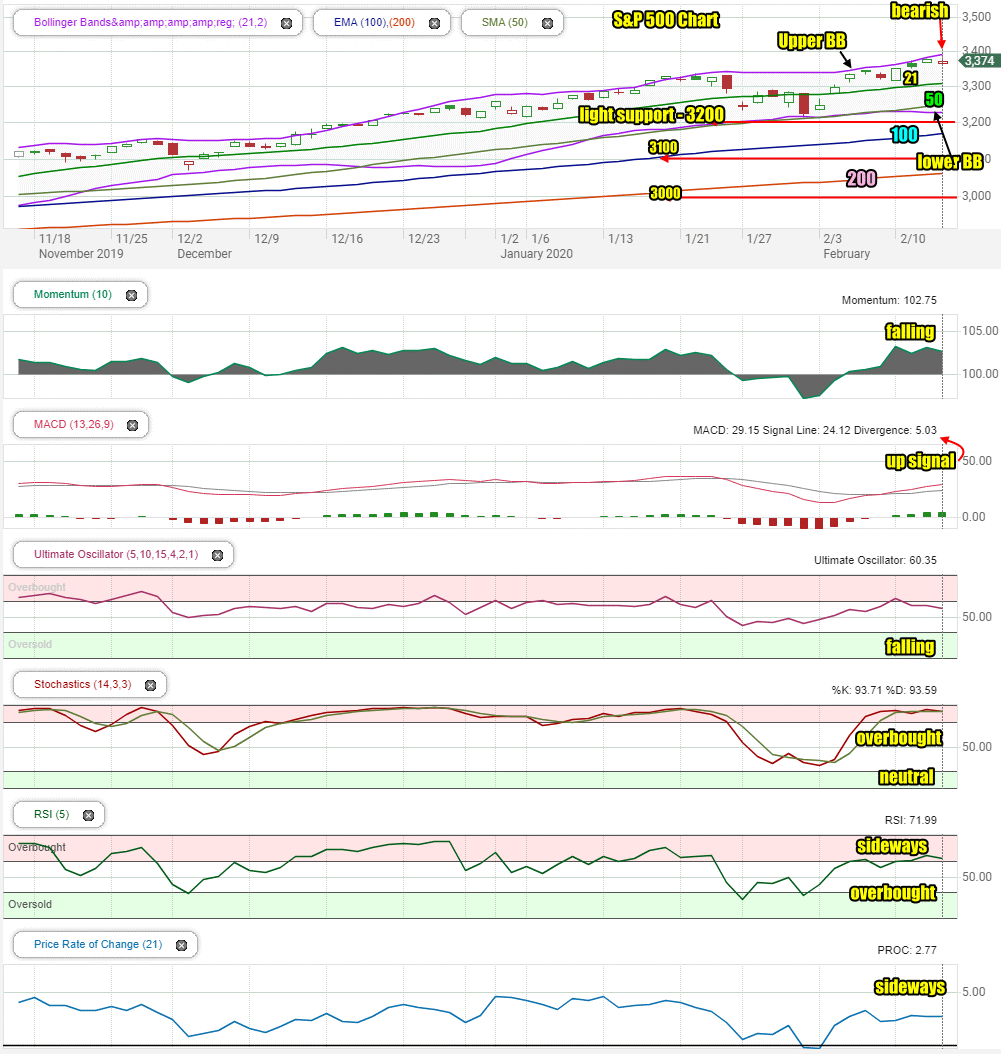
The SPX chart is still bullish although the candlestick is warning of a lower day for Friday. That could indeed be the case as we head into the long President’s Day holiday weekend as many investors won’t want to hold positions over the weekend. Instead many investors will take some or part profits before the weekend starts.
The Upper Bollinger Band is rising and the Lower Bollinger Band is falling back. This is bullish and signals more upside action is expected.
As well all the major moving averages are continuing to climb higher.
There are four support levels in place. These are light support at 3200, 3100 which is a full 100 points lower, 3075 which is light support and 3000 which is major support.
Stock Market Outlook review of Feb 13 2020
Stock Market Outlook: Technical Indicators Review:
Momentum: Momentum is positive and falling.
- Settings: For momentum I use a 10 period when studying market direction.
MACD Histogram: MACD (Moving Averages Convergence / Divergence) issued an up signal on Friday Feb 7. The up signal was stronger on Thursday.
- Settings: For MACD Histogram, I am using the Fast Points set at 13, Slow Points at 26 and Smoothing at 9.
Ultimate Oscillator: The Ultimate Oscillator signal is also falling slightly.
- Settings: The Ultimate Oscillator settings are: Period 1 is 5, Period 2 is 10, Period 3 is 15, Factor 1 is 4, Factor 2 is 2 and Factor 3 is 1. These are not the default settings but are the settings I use with the S&P 500 chart set for 1 to 3 months.
Slow Stochastic: The Slow Stochastic has a neutral signal in place for tomorrow and remains, overbought.
- Settings: For the Slow Stochastic I use the K period of 14 and D period of 3. The Slow Stochastic tries to predict the market direction further out than just one day.
Relative Strength Index: The RSI signal is trending sideways and is overbought.
- Settings: The relative strength index is set for a period of 5 which gives it 5 days of market movement to monitor. It is often the first indicator to show an overbought or oversold signal.
Rate of Change: The rate of change signal is moving sideways for a second day, indicating no change in prices is expected for Friday.
- Settings: Rate Of Change is set for a 21 period. This indicator looks back 21 days and compares price action from the past to the present. With the Rate Of Change, prices are rising when signals are positive. Conversely, prices are falling when signals are negative. As an advance rises the Rate Of Change signal should also rise higher, otherwise the rally is suspect. A decline should see the Rate Of Change fall into negative signals. The more negative the signals the stronger the decline.
Support and Resistance Levels To Be Aware Of:
3350 is resistance
3200 is light support
3100 is light support
3075 is light support
3030 is very light support
3000 is good support and if the S&P fell this low it would mark a normal correction in a bull market
2960 is light support
2900 is light support
2860 is light support
2840 is good support
2800 is strong support
Stock Market Outlook for Tomorrow – Fri Feb 14 2020
For Friday the technical indicators are a bit mixed with a number dipping lower, a neutral signal from the Slow Stochastic and a stronger up signal from MACD.
That means we should expect some weakness on Friday and probably a large dip or even two but overall the market, even if it closes slightly lower on Friday, is entrenched and ready to move higher shortly.
For Friday Feb 14 then, watch for weakness but a higher close.
Stock Market Outlook Archives
Stock Market Outlook For Wed May 6 2026 – Choppy But Higher Still

Morning Investing Strategy Notes for Tue May 5 2026

Stock Market Outlook For Tue May 5 2026 – Overbought and Lower

Morning Investing Strategy Notes for Mon May 4 2026
Stock Market Outlook For Mon May 4 2026 – Dips Likely With Possible Lower Close

Morning Investing Strategy Notes for Fri May 1 2026
Stock Market Outlook For Fri May 1 2026 – Overbought But Higher

Morning Investing Strategy Notes for Thu Apr 30 2026
Stock Market Outlook For Thu Apr 30 2026 – Dips Likely Possible Lower Close
Morning Investing Strategy Notes for Wed Apr 29 2026
Stock Market Outlook For Wed Apr 29 2026 – Choppy But Higher Ahead Of More Earnings

Morning Investing Strategy Notes for Tue Apr 28 2026