

Stock Indexes on Wednesday jumped at the open and didn’t look back. With investors no longer focused on the coronavirus as reports indicate the number of cases is declining, buying was swift across the indexes. By the close all three indexes were sitting at new all-time highs once again in what has become once of the strongest daily rallies since 2010.
Stock Market Outlook Chart Comments At The Close on Wed Feb 12 2020
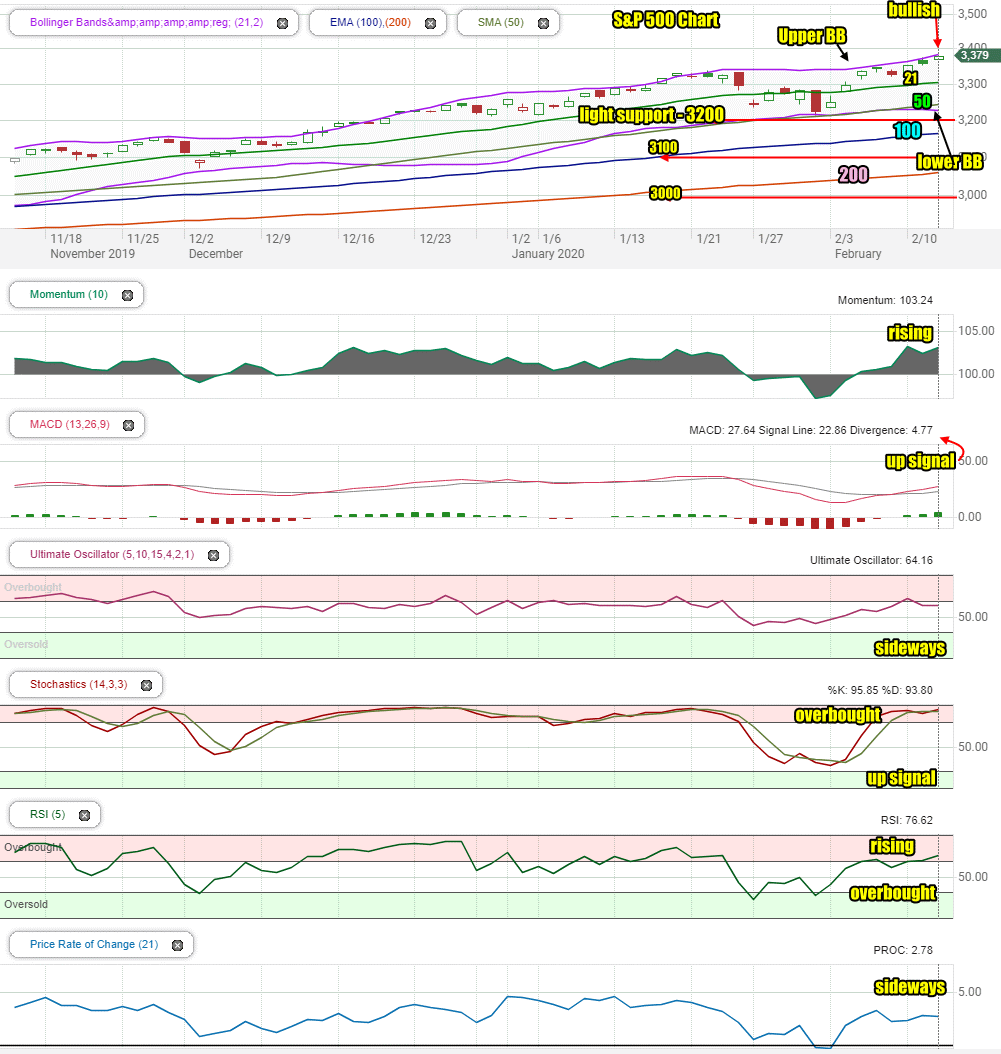
The SPX chart is still bullish and the closing candlestick is bullish for Thursday despite the candlestick from Tuesday’s close which showed the potential for a down day. That could happen on Friday as investors take profits ahead of the long weekend.
The index is continuing to pressure the Upper Bollinger Band to move higher which is bullish and the Lower Bollinger Band is falling lower ending the chance of a Bollinger Bands Squeeze this week.
As well all the major moving averages are continuing to climb higher.
There are four support levels in place. These are light support at 3200, 3100 which is a full 100 points lower, 3075 which is light support and 3000 which is major support.
Stock Market Outlook review of Wed Feb 12 2020
Stock Market Outlook: Technical Indicators Review:
Momentum: Momentum is positive and rising.
- Settings: For momentum I use a 10 period when studying market direction.
MACD Histogram: MACD (Moving Averages Convergence / Divergence) issued an up signal on Friday Feb 7. The up signal was stronger on Wednesday.
- Settings: For MACD Histogram, I am using the Fast Points set at 13, Slow Points at 26 and Smoothing at 9.
Ultimate Oscillator: The Ultimate Oscillator signal is moving sideways which is neutral on tomorrow’s outlook.
- Settings: The Ultimate Oscillator settings are: Period 1 is 5, Period 2 is 10, Period 3 is 15, Factor 1 is 4, Factor 2 is 2 and Factor 3 is 1. These are not the default settings but are the settings I use with the S&P 500 chart set for 1 to 3 months.
Slow Stochastic: The Slow Stochastic has an up signal in place for tomorrow and remains, overbought.
- Settings: For the Slow Stochastic I use the K period of 14 and D period of 3. The Slow Stochastic tries to predict the market direction further out than just one day.
Relative Strength Index: The RSI signal is rising and overbought.
- Settings: The relative strength index is set for a period of 5 which gives it 5 days of market movement to monitor. It is often the first indicator to show an overbought or oversold signal.
Rate of Change: The rate of change signal is moving sideways signaling that equity prices are not expected to change much if at all on Thursday.
- Settings: Rate Of Change is set for a 21 period. This indicator looks back 21 days and compares price action from the past to the present. With the Rate Of Change, prices are rising when signals are positive. Conversely, prices are falling when signals are negative. As an advance rises the Rate Of Change signal should also rise higher, otherwise the rally is suspect. A decline should see the Rate Of Change fall into negative signals. The more negative the signals the stronger the decline.
Support and Resistance Levels To Be Aware Of:
3350 is resistance
3200 is light support
3100 is light support
3075 is light support
3030 is very light support
3000 is good support and if the S&P fell this low it would mark a normal correction in a bull market
2960 is light support
2900 is light support
2860 is light support
2840 is good support
2800 is strong support
Stock Market Outlook for Tomorrow – Thu Feb 13 2020
On Thursday there is a good chance for some weakness to start the day off but once again we will see the dip buyers return and stocks will finish higher.
This has been a very strong rally with every dip, even shallow ones, being bought into swiftly by investors. Friday though we could see a sideways day or even a negative day ahead of the long President’s holiday weekend. But for now we should continue to enjoy the new highs and the rise of equities still higher on Thursday.
Stock Market Outlook Archives
Stock Market Outlook For Wed May 6 2026 – Choppy But Higher Still

Morning Investing Strategy Notes for Tue May 5 2026

Stock Market Outlook For Tue May 5 2026 – Overbought and Lower

Morning Investing Strategy Notes for Mon May 4 2026
Stock Market Outlook For Mon May 4 2026 – Dips Likely With Possible Lower Close

Morning Investing Strategy Notes for Fri May 1 2026
Stock Market Outlook For Fri May 1 2026 – Overbought But Higher

Morning Investing Strategy Notes for Thu Apr 30 2026
Stock Market Outlook For Thu Apr 30 2026 – Dips Likely Possible Lower Close
Morning Investing Strategy Notes for Wed Apr 29 2026
Stock Market Outlook For Wed Apr 29 2026 – Choppy But Higher Ahead Of More Earnings

Morning Investing Strategy Notes for Tue Apr 28 2026