

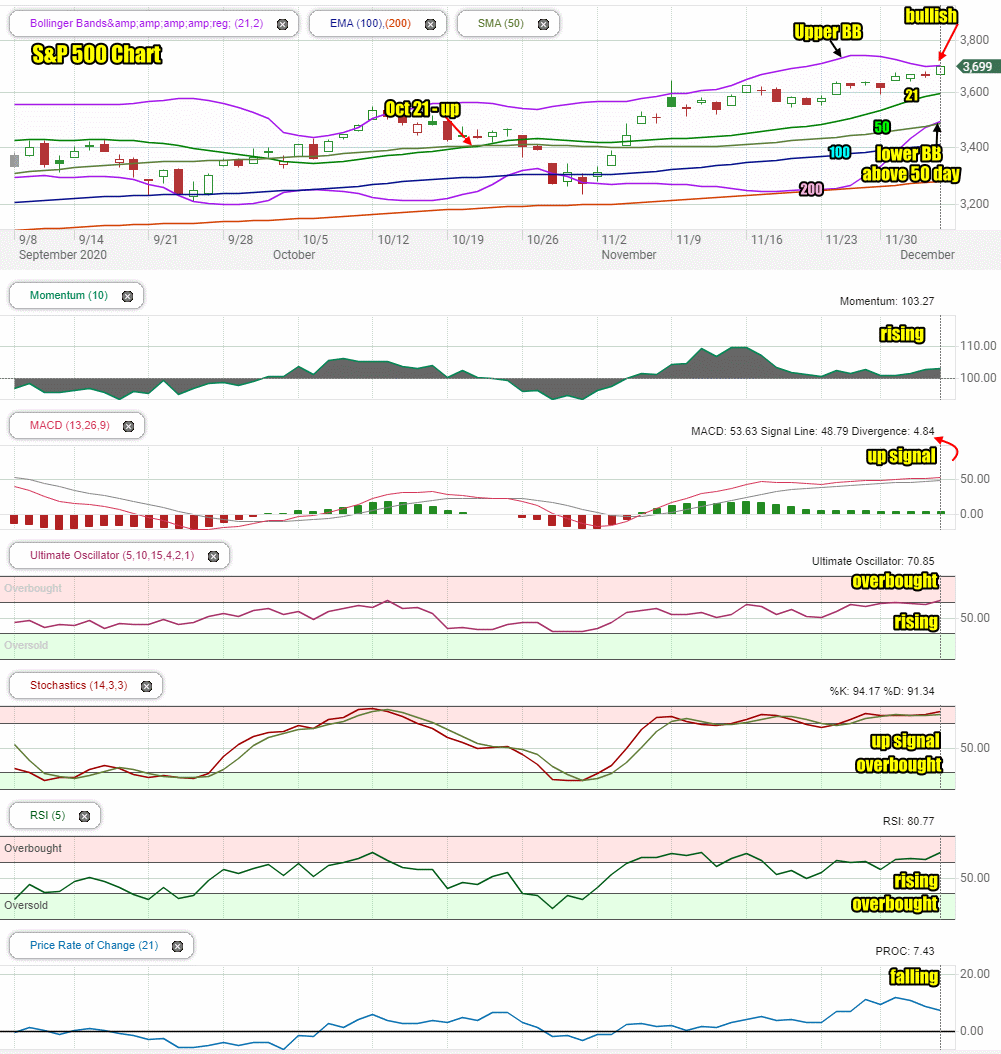
Friday saw the market react positively to lower than expected November employment numbers. Investors took the lower numbers in stride and as the day wore on they continued to push the index higher. By the end of the day, the S&P was at a new all-time high at 3699.
Stock Market Outlook Chart Comments At The Close on Fri Dec 4 2020
Friday saw the index close above 3600 for the 8th straight trading day. The closing candlestick was bullish for Monday and pushed to the Upper Bollinger Band.
Meanwhile the Upper Bollinger Band has turned sideways while the Lower Bollinger Band is now above the 50 day moving average pushing the index into a Bollinger Bands Squeeze to start the second week of December.
The 21 day, 50 day, 100 day and 200 day moving averages are all rising, a bullish sign. The 21 day is rising rapidly as well and on the verge of moving above 3600. Often the speed of the climb for the 21 day indicates a dip should be expected shortly as the index is overbought. The up signal from Oct 21 is still in play, and the chart remains bullish despite the closing candlestick, concerns over the rise of the 21 day and the Bollinger Bands Squeeze developing.
Stock Market Outlook: Technical Indicators Review:
Momentum: Momentum is rising and positive.
- Settings: For momentum I use a 10 period when studying market direction.
MACD Histogram: MACD (Moving Averages Convergence / Divergence) issued an up signal on Nov 5. The up signal on Friday was slightly stronger.
- Settings: For MACD Histogram, I am using the Fast Points set at 13, Slow Points at 26 and Smoothing at 9.
Ultimate Oscillator: The Ultimate Oscillator is rising and overbought.
- Settings: The Ultimate Oscillator settings are: Period 1 is 5, Period 2 is 10, Period 3 is 15, Factor 1 is 4, Factor 2 is 2 and Factor 3 is 1. These are not the default settings but are the settings I use with the S&P 500 chart set for 1 to 3 months.
Slow Stochastic: The Slow Stochastic has an up signal in place. It is overbought.
Settings: For the Slow Stochastic I use the K period of 14 and D period of 3. The Slow Stochastic tries to predict the market direction further out than just one day.
Relative Strength Index: The RSI signal is rising and overbought.
- Settings: The relative strength index is set for a period of 5 which gives it 5 days of market movement to monitor. It is often the first indicator to show an overbought or oversold signal.
Rate of Change: The rate of change signal is falling for a third straight day.
- Settings: Rate Of Change is set for a 21 period. This indicator looks back 21 days and compares price action from the past to the present. With the Rate Of Change, prices are rising when signals are positive. Conversely, prices are falling when signals are negative. As an advance rises the Rate Of Change signal should also rise higher, otherwise the rally is suspect. A decline should see the Rate Of Change fall into negative signals. The more negative the signals the stronger the decline.
Support and Resistance Levels To Be Aware Of:
3600 is resistance
3550 is support
3500 is support
3450 is support
3400 is support
3375 is support
3300 is support
3275 is support
3200 is support
3150 is support
3050 is support
3000 is support
Stock Market Outlook for Tomorrow – Mon Dec 7 2020
For Monday, the index is very overbought. Don’t be surprised by dips that could even become deeper than expected.
Two things to be concerned about is the overbought market and the Bollinger Bands Squeeze which the market is entering.
For Monday though the market will probably remain overbought and still move higher to break 3700.
Stock Market Outlook Archives
Stock Market Outlook For Wed May 6 2026 – Choppy But Higher Still

Morning Investing Strategy Notes for Tue May 5 2026

Stock Market Outlook For Tue May 5 2026 – Overbought and Lower

Morning Investing Strategy Notes for Mon May 4 2026
Stock Market Outlook For Mon May 4 2026 – Dips Likely With Possible Lower Close

Morning Investing Strategy Notes for Fri May 1 2026
Stock Market Outlook For Fri May 1 2026 – Overbought But Higher

Morning Investing Strategy Notes for Thu Apr 30 2026
Stock Market Outlook For Thu Apr 30 2026 – Dips Likely Possible Lower Close
Morning Investing Strategy Notes for Wed Apr 29 2026
Stock Market Outlook For Wed Apr 29 2026 – Choppy But Higher Ahead Of More Earnings

Morning Investing Strategy Notes for Tue Apr 28 2026