
 On Wednesday Dec 28 the markets pulled back following failed repeated attempts by the Dow to break to 20,000 and for the S&P to break beyond 2270.
S&P Index Close
The S&P index ended the day down 18.96 to close at 2249.92
Dow Jones Index
The Dow Jones ended the day down 111.35 to close at 19,833.68
NASDAQ Index Close
The NASDAQ closed down 48.89 points to 5,438.56.
Stock Market Outlook
Chart Comments At The Close:
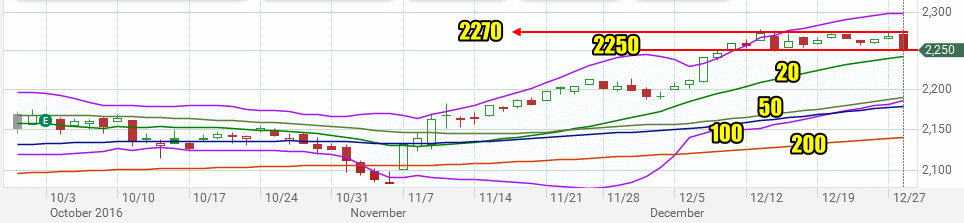
SPX Dec 28 2016
The S&P pulled back today after reaching the 2270 level earlier in the day. The pullback took the S&P down to the 2250 level where it closed just below it.
This places the index still above the 20 period moving average and within a very tight trading range which the index has been in for 13 trading sessions.
All the major moving averages are continuing to move higher and the Bollinger Bands are continuing to rise.
Support Levels To Be Aware Of:
There is no support at 2200. There is light support at 2195 but better support is at 2180 and then 2150.
Stock Market Outlook: Technical Indicators:
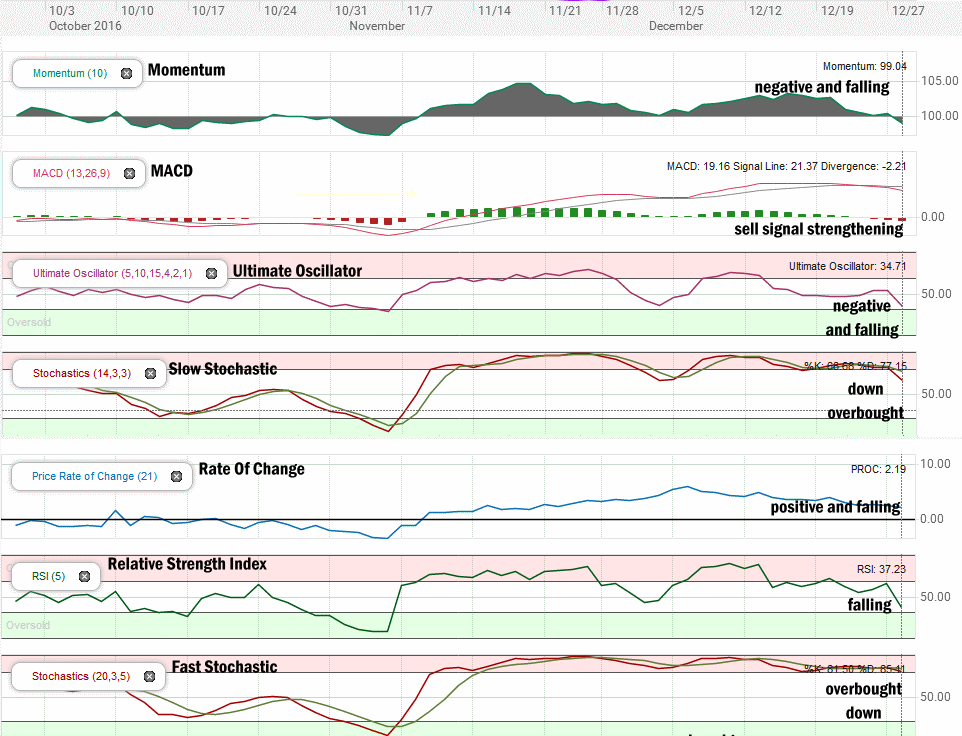
Stock Market Outlook technical review from Dec 28 2016
Momentum: For momentum I use a 10 period when studying market direction. Momentum is negative and falling.
MACD Histogram: For MACD Histogram, I am using the Fast Points set at 13, Slow Points at 26 and Smoothing at 9. MACD (Moving Averages Convergence / Divergence) issued a sell signal on Dec 23. This is the first sell signal since Oct 28. The sell signal is gathering strength.
Ultimate Oscillator: The Ultimate Oscillator settings are: Period 1 is 5, Period 2 is 10, Period 3 is 15, Factor 1 is 4, Factor 2 is 2 and Factor 3 is 1. These are not the default settings but are the settings I use with the S&P 500 chart set for 1 to 3 months. The Ultimate Oscillator is negative and falling.
Slow Stochastic: For the Slow Stochastic I use the K period of 14 and D period of 3. The Slow Stochastic tries to predict the market direction further out than just one day. The Slow Stochastic is signaling down for stocks and is overbought.
Rate of Change: Rate Of Change is set for a 21 period. This indicator looks back 21 days and compares price action from the past to the present. The rate of change signal is positive but falling.
Relative Strength Index: The relative strength index is set for a period of 5 which gives it 5 days of market movement to monitor. It often is the first indicator to show an overbought or oversold signal. It is falling.
Fast Stochastic: For the Fast Stochastic I use the K period of 20 and D period of 5. These are not default settings but settings I use for the 1 to 3 month S&P 500 chart when I have it set for daily views. The Fast Stochastic is signaling down and is also overbought.
Stock Market Outlook for Tomorrow – Dec 29 2016
With low volume the S&P is having trouble moving higher. All the indexes pulled back on Wednesday but on low volume which makes any pullback suspect. This is a strong seasonal period for stocks. However as of the close on Wednesday there are 6 technical indicators either with sell signals, down signals or falling. Only one signal is still showing strength.
The outlook for Thursday has to change to down although I am still of the opinion that once volume returns the markets will push higher. However I cannot ignore what the technical indicators are advising. There are too many signals flashing warning signs. Caution is now warranted as the market tries to stop any further selling and bounce back. That may be a difficult chore for Thursday.
Stay FullyInformed With Email Updates
Market Direction Internal Links
Profiting From Understanding Market Direction (Articles Index)
Understanding Short-Term Signals
Market Direction Portfolio Trades (Members)
Market Direction External Links
IWM ETF Russell 2000 Fund Info
Market Direction SPY ETF 500 Fund Info