

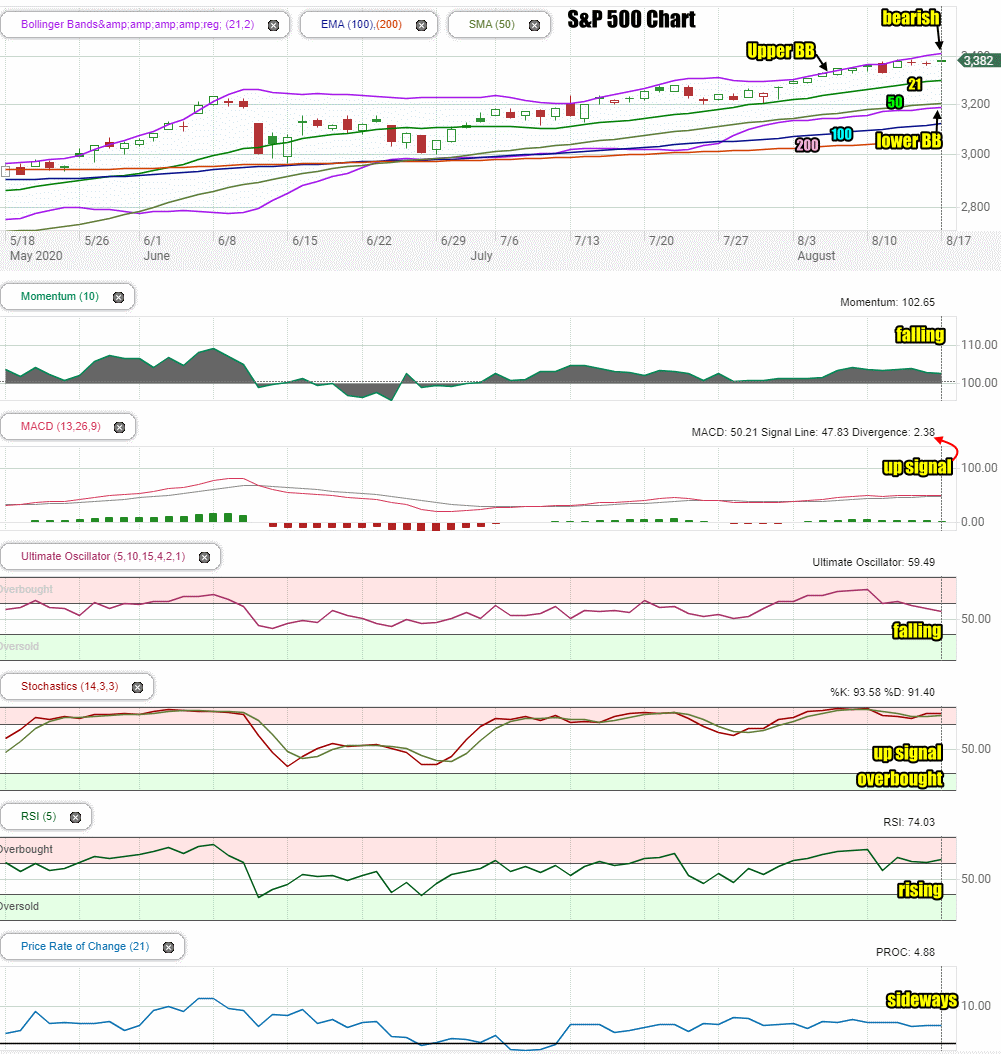
Monday saw the S&P and NASDAQ continue to push higher. The S&P is within a handful of points of making a new all-time high. It closed at 3381.99 on Monday, up 9 points.
Stock Market Outlook Chart Comments At The Close on Mon Aug 17 2020
There is very little change in the index chart following Monday’s close although the closing candlestick was bearish for a second straight day. We should see a down day shortly if the candlesticks are correct.
The Upper Bollinger Band moved higher again on Monday but the index did not follow it higher which tends to be a bit bearish.
There are now 6 up signals and one down signal when the Lower Bollinger Band moving above the 100 day moving average back on July 27. At present the Lower Bollinger Band is trending just below the 50 day moving average indicating how tight the trend higher has stayed.
The 21, 50, 100 and 200 day moving averages and continuing to climb. The SPX chart is still more bullish than bearish but a number of the technical indicators are turning bearish.
Stock Market Outlook review of Mon Aug 17 2020
Stock Market Outlook: Technical Indicators Review:
Momentum: Momentum is falling but still positive.
- Settings: For momentum I use a 10 period when studying market direction.
MACD Histogram: MACD (Moving Averages Convergence / Divergence) issued an up signal on Monday Aug 3. On Monday the signal weakened further.
- Settings: For MACD Histogram, I am using the Fast Points set at 13, Slow Points at 26 and Smoothing at 9.
Ultimate Oscillator: The Ultimate Oscillator is falling lower.
- Settings: The Ultimate Oscillator settings are: Period 1 is 5, Period 2 is 10, Period 3 is 15, Factor 1 is 4, Factor 2 is 2 and Factor 3 is 1. These are not the default settings but are the settings I use with the S&P 500 chart set for 1 to 3 months.
Slow Stochastic: The Slow Stochastic has an up signal in place and is still overbought.
Settings: For the Slow Stochastic I use the K period of 14 and D period of 3. The Slow Stochastic tries to predict the market direction further out than just one day.
Relative Strength Index: The RSI signal is rising.
- Settings: The relative strength index is set for a period of 5 which gives it 5 days of market movement to monitor. It is often the first indicator to show an overbought or oversold signal.
Rate of Change: The rate of change signal is moving sideways indicating little change in prices is expected.
- Settings: Rate Of Change is set for a 21 period. This indicator looks back 21 days and compares price action from the past to the present. With the Rate Of Change, prices are rising when signals are positive. Conversely, prices are falling when signals are negative. As an advance rises the Rate Of Change signal should also rise higher, otherwise the rally is suspect. A decline should see the Rate Of Change fall into negative signals. The more negative the signals the stronger the decline.
Support and Resistance Levels To Be Aware Of:
3375 is resistance
3300 is resistance
3275 is support
3200 is support
3150 is support
3050 is support
3000 is support
2975 is light support
2950 is light support
2900 is light support
2860 is light support
2840 is light support
2800 is good support
2725 is light support
2700 is light support and marked a drop of 20.4%.
2500 was good support and marked a correction of 26.3%
2191 was the market low on March 23
Stock Market Outlook for Tomorrow – Tue Aug 18 2020
For Tuesday the index is still overbought and the technical indicators are signaling that investors should be prepared for some dips. However dips are still opportunities to setup trades as the close on Tuesday should be higher.
Stock Market Outlook Archives
Stock Market Outlook For Wed May 6 2026 – Choppy But Higher Still

Morning Investing Strategy Notes for Tue May 5 2026

Stock Market Outlook For Tue May 5 2026 – Overbought and Lower

Morning Investing Strategy Notes for Mon May 4 2026
Stock Market Outlook For Mon May 4 2026 – Dips Likely With Possible Lower Close

Morning Investing Strategy Notes for Fri May 1 2026
Stock Market Outlook For Fri May 1 2026 – Overbought But Higher

Morning Investing Strategy Notes for Thu Apr 30 2026
Stock Market Outlook For Thu Apr 30 2026 – Dips Likely Possible Lower Close
Morning Investing Strategy Notes for Wed Apr 29 2026
Stock Market Outlook For Wed Apr 29 2026 – Choppy But Higher Ahead Of More Earnings

Morning Investing Strategy Notes for Tue Apr 28 2026