
Monday April 17 saw stocks rally back from a two month low on low volume. The rally though was broad with much of the buying happening within the financial sector and technology stocks which have been beaten down over the past week.
S&P Index Close
The S&P index ended the day up 20.06 points to close at 2349.01
Dow Jones Index Close
The Dow Jones ended up 183.67 points to 20,636.92
NASDAQ Index Close
The NASDAQ closed up 51.64 points to end the day at 5,856.79
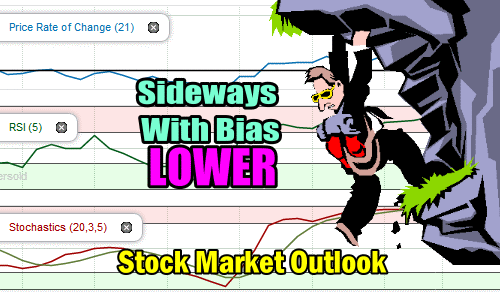
Stock Market Outlook
Chart Comments At The Close:
Monday saw the 21 day moving average move to meet the 50 day, normally a bearish signal. The S&P closed with a bullish candlestick but still below the 21 and 50 day moving averages. The index recovered to the 2350 level. The index must push above the 21 day to establish a new pattern.
At present the chart pattern continues to support weakness with a pattern of lower highs but not yet lower lows.
The 100 and 200 day moving averages are still climbing which is bullish.

Stock Market Outlook review of Apr 17 2017
Stock Market Outlook: Technical Indicators:
Momentum: For momentum I use a 10 period when studying market direction. Momentum is negative but rising.
MACD Histogram: For MACD Histogram, I am using the Fast Points set at 13, Slow Points at 26 and Smoothing at 9. MACD (Moving Averages Convergence / Divergence) issued a sell signal Mar 7 2017. The sell signal is weak but is still holding steady.
Ultimate Oscillator: The Ultimate Oscillator settings are: Period 1 is 5, Period 2 is 10, Period 3 is 15, Factor 1 is 4, Factor 2 is 2 and Factor 3 is 1. These are not the default settings but are the settings I use with the S&P 500 chart set for 1 to 3 months. The Ultimate Oscillator is back positive but moving more in a sideways pattern than up or down.
Slow Stochastic: For the Slow Stochastic I use the K period of 14 and D period of 3. The Slow Stochastic tries to predict the market direction further out than just one day. The Slow Stochastic has a down signal still in place.
Rate of Change: Rate Of Change is set for a 21 period. This indicator looks back 21 days and compares price action from the past to the present. The rate of change signal is negative but bounced off extremely oversold signals.
Relative Strength Index: The relative strength index is set for a period of 5 which gives it 5 days of market movement to monitor. It often is the first indicator to show an overbought or oversold signal. The RSI signal is rising.
Fast Stochastic: For the Fast Stochastic I use the K period of 20 and D period of 5. These are not default settings, but settings I use for the 1 to 3 month S&P 500 chart when I have it set for daily views. The Fast Stochastic has a down signal still in place.
Support Levels To Be Aware Of:
The market has light support at the 2350, 2300 and the 2250 level. There is also light support at 2195 but better support is at 2180 and then 2150.
Stock Market Outlook for Tomorrow – Tuesday Apr 18 2017
The rally on Monday was a combination of a technical bounce from an oversold condition and investor focus moving back toward earnings.
Many stocks were badly beaten down in the past 3 trading sessions last week. Today was an opportunity for many investors to pick up some stocks cheaper than they were just a week prior.
Overall though, volume was low and the majority of technical indicators remain negative.
The two stochastic indicators are both still pointing down and MACD refuses to signal a move up.
This makes the rally on Monday suspect. The S&P needs to retake the 2350 level and then move above it and stay above it. By the close on Monday the 21 day moving average had already fallen to the 50 day. If it moves below it, it is a major signal of weakness.
Tuesday is important for stocks. Investors need to see the index not waffle but instead move higher and hold the 2350 level convincingly. The outlook though is not supportive of that happening. Instead the outlook is for stocks to try to move higher at the open, turn lower and then struggle sideways. A lot depends on earnings tomorrow from companies like Goldman Sachs. Better than expected earnings is needed to push the indexes higher. The bank earnings on Thursday were mixed. Netflix earnings after the close on Monday were decent but subscriber growth was poor. So far then, earnings season is still flat.
Tuesday may give us a better indication but at present the outlook is still sideways with a slight bias lower as the rally on Monday, while nice, remains highly suspect.
Stay FullyInformed With Email Updates
Market Direction Internal Links
Profiting From Understanding Market Direction (Articles Index)
Understanding Short-Term Signals
Market Direction Portfolio Trades (Members)
Market Direction External Links
IWM ETF Russell 2000 Fund Info
Market Direction SPY ETF 500 Fund Info