FullyInformed.com
Generic filters
Exact matches only
Search in title
Search in content
Search in excerpt

Stock Market Outlook for Apr 12 2017 – Sideways Bias Lower

Apr 12, 2017 | Stock Market Outlook

Stock Market Outlook - sideways bias lower

Tuesday Apr 11 2017 saw a deep dip in the morning and a jump in both gold prices and the VIX Index, often referred to as the “fear index”.

However by the close the markets had recovered almost all the morning losses and prepared the market for the upcoming earnings on Wednesday and more important, on Thursday.

S&P Index Close

The S&P index ended the day down 3.38 points to close at 2353.78

Dow Jones Index Close

The Dow Jones ended down 6.72 points to 20,651.30.

NASDAQ Index Close

The NASDAQ closed down 14.15 points to end the day at 5,866.77.


Stock Market Outlook

Chart Comments At The Close:

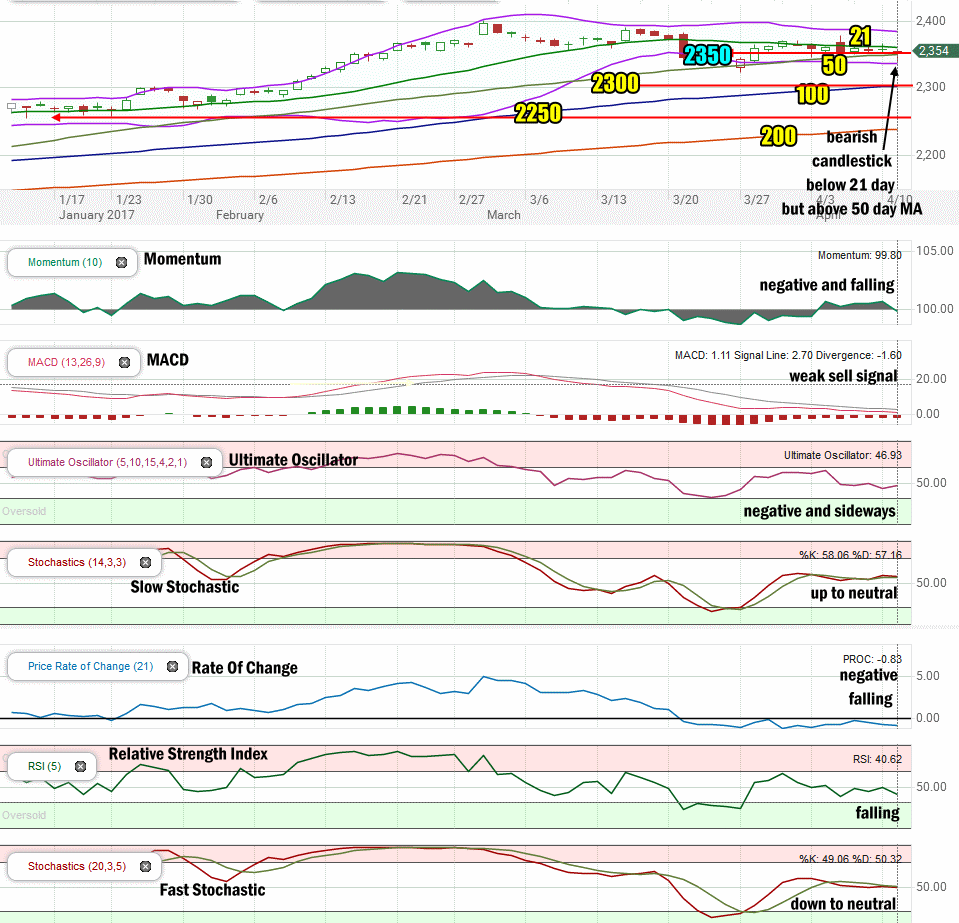
The close at the end of the day on Tuesday Apr 11 2017, saw the S&P with the index still trailing below the 21 day moving average and just above the 50 day moving average. During the day on Tuesday, the index fell through the 50 day and hit the Lower Bollinger Band. Right at the Lower Bollinger Band the index bounced but the close was weak and left behind a bearish candlestick for Wednesday.

The 50 day moving average is almost ready to move above the falling 21 day moving average which is a bearish sell signal when it happens. Both the Upper Bollinger Band and Lower Bollinger Band are moving lower, dragging the 21 day lower. The 21 day moving average peaked on Mar 20 and has been declining ever since.

The 50, 100 and 200 day moving averages are still climbing which is bullish. Overall the signals from the chart are more bearish than bullish for Wednesday.

Stock Market Outlook review of Apr 11 2017

Stock Market Outlook: Technical Indicators:

Momentum: For momentum I use a 10 period when studying market direction. Momentum is negative and falling.

MACD Histogram: For MACD Histogram, I am using the Fast Points set at 13, Slow Points at 26 and Smoothing at 9. MACD (Moving Averages Convergence / Divergence) issued a sell signal Mar 7 2017. The sell signal is weak but remains in place for what is now more than a month. When the sell signal was issued, the S&P closed at 2368.39. On Tuesday the S&P closed at 2353.78 for a loss of just 14.61 points for over a month of trading. This shows how sideways the market has stayed for the past 4 weeks.

Ultimate Oscillator: The Ultimate Oscillator settings are: Period 1 is 5, Period 2 is 10, Period 3 is 15, Factor 1 is 4, Factor 2 is 2 and Factor 3 is 1. These are not the default settings but are the settings I use with the S&P 500 chart set for 1 to 3 months. The Ultimate Oscillator is negative and sideways.

Slow Stochastic: For the Slow Stochastic I use the K period of 14 and D period of 3. The Slow Stochastic tries to predict the market direction further out than just one day. The Slow Stochastic has an up to neutral signal in place.

Rate of Change: Rate Of Change is set for a 21 period. This indicator looks back 21 days and compares price action from the past to the present.  The rate of change signal is negative and falling indicating lower prices lie ahead.

Relative Strength Index: The relative strength index is set for a period of 5 which gives it 5 days of market movement to monitor.  It often is the first indicator to show an overbought or oversold signal.  The RSI signal is falling.

Fast Stochastic: For the Fast Stochastic I use the K period of 20 and D period of 5. These are not default settings, but settings I use for the 1 to 3 month S&P 500 chart when I have it set for daily views. The Fast Stochastic has a neutral to down signal in place.


Support Levels To Be Aware Of:

The market has light support at the 2350, 2300 and the 2250 level.  There is also light support at 2195 but better support is at 2180 and then 2150.


 Stock Market Outlook for Tomorrow – Wednesday Apr 12 2017

For Wednesday the technical indicators are pointing to more weakness with a sideways pattern. The market drops in the morning and then late day recoveries is continuing to set up a pattern that is slowly strengthening many of the technical sell signals on the market. This is something investors would be aware of.

However, that said, there are still signs that if the earnings are good to above expectations on Thursday when a number of the big banks report earnings, the market should be able to push higher.

Wednesday however looks weak. The morning open could be positive but then I am expecting some selling unless Delta Air Lines Stock earnings are beyond expectations. Otherwise watch for the markets to stay weak and possible negative into the close on Wednesday ahead of Bank earnings on Thursday.


Stay FullyInformed With Email Updates

    Your First Name (required)

    Your Email (required)

    Anti-Spam: Please Answer This Math Question

    I will send you a reply to confirm that you want to subscribe before sending any emails.


     Market Direction Internal Links

    Profiting From Understanding Market Direction (Articles Index)

    How I Use Market Timing

    How I Use Market Timing

    Understanding Short-Term Signals

    Various Market Timing Systems

    Market Direction Portfolio Trades (Members)

    Market Direction External Links

    Market Direction

    IWM ETF Russell 2000 Fund Info

    Market Direction SPY ETF 500 Fund Info


    Recent Outlooks

    Stock Market Outlook For Thu May 7 2026 – Bullish and Still Higher

    Prior Trading Day Summary On Wednesday stocks soared as strong earnings from Advanced Micro Devices Stock (AMD) sparked another rally. The SPX made another new intraday high as it reached 7369. The index closed up 106 points to end the …

    Morning Investing Strategy Notes for Wed May 6 2026

    For FullyInformed Members the morning Investing Strategy Notes for Wed May 6 2026 look at the rebound on Tuesday following Monday’s selling.. There are a large number of equities discussed in today’s morning Investing Strategy Notes. They include Palantir Tech …

    Stock Market Outlook For Wed May 6 2026 – Choppy But Higher Still

    Prior Trading Day Summary On Tuesday stocks again shook off Middle East worries and climbed higher. The SPX made another new intraday high as it reached 7273. The index closed up 58 points to end the day at 7259 on …

    Morning Investing Strategy Notes for Tue May 5 2026

    For FullyInformed Members the morning Investing Strategy Notes for Tue May 5 2026 look at the dip on Monday and the chance for another lower close today. There are a large number of equities discussed in today’s morning Investing Strategy …

    Stock Market Outlook For Tue May 5 2026 – Overbought and Lower

    Prior Trading Day Summary On Monday stocks saw some minor pressure and ended the day slightly lower. The SPX lost 29 points to close at 7200 on 5.2 billion shares traded. 63% of all stocks were falling by the close …

    Morning Investing Strategy Notes for Mon May 4 2026

    For FullyInformed Members the morning Investing Strategy Notes for Mon May 4 2026 look at the chance for a lower close. There are a large number of equities discussed in today’s morning Investing Strategy Notes. They include Palantir Tech Stock …

    Stock Market Outlook For Mon May 4 2026 – Dips Likely With Possible Lower Close

    Prior Trading Day Summary On Friday stocks continued to push higher on the back of better than estimated earnings from a number of large cap companies. With their stocks continuing to climb, stocks are once more extremely overbought. The SPX …

    Morning Investing Strategy Notes for Fri May 1 2026

    For FullyInformed Members the morning Investing Strategy Notes for Fri May 1 2026 look at the chance for another closing new high on Friday. There are a large number of equities discussed in today’s morning Investing Strategy Notes. They include …

    Stock Market Outlook For Fri May 1 2026 – Overbought But Higher

    Prior Trading Day Summary On Thursday earnings from a number of big cap stocks like Alphabet Stock (GOOGL) and Eli Lilly Stock (LLY) helped to push the indexes to new all-time highs yet again. The SPX rose 73 points to …

    Morning Investing Strategy Notes for Thu Apr 30 2026

    For FullyInformed Members the morning Investing Strategy Notes for Thu Apr 30 2026 look at the odds of a lower day. There are a large number of equities discussed in today’s morning Investing Strategy Notes. They include Alphabet Stock (GOOGL), …

    Stock Market Outlook For Thu Apr 30 2026 – Dips Likely Possible Lower Close

    Prior Trading Day Summary On Wednesday the SPX closed slightly lower while the NASDAQ closed higher ending the day with a mixed outlook. The SPX fell 3 points to close at 7135 on 5.2 billion shares traded. Just 37% of …

    Morning Investing Strategy Notes for Wed Apr 29 2026

    For FullyInformed Members the morning Investing Strategy Notes for Wed Apr 29 2026 look at expectations for profits on Wednesday and especially Thursday. There are a large number of equities discussed in today’s morning Investing Strategy Notes. They include Nucor …

    Stock Market Outlook For Wed Apr 29 2026 – Choppy But Higher Ahead Of More Earnings

    Prior Trading Day Summary On Tuesday both the SPX and NASDAQ lost a little ground but the bigger earnings are set to be released starting tomorrow. The SPX fell 35 points to close at 7178 on 5 billion shares traded …

    Morning Investing Strategy Notes for Tue Apr 28 2026

    For FullyInformed Members the morning Investing Strategy Notes for Tue Apr 28 2026 look at anticipated market action for today. There are a number of equities discussed in today’s morning Investing Strategy Notes. They include Intel Stock (INTC), Nucor Stock …

    Subscribe For The Latest News