
The second Buffett bank I am looking at for Put Selling opportunities is Goldman Sachs. Goldman Sachs stock trades on New York under the symbol GS. In an interview last week on CNBC, Warren Buffett named Goldman Sachs among his 5 favorite banks he thinks will do well into 2014. I can see that being the case from Buffett’s perspective. He picked up about $2 billion in revenue from a trade on warrants that he did with Goldman Sachs during the height of the financial crisis. Goldman Sachs needed cash and Buffett supplied it to the tune of $5 billion. He received a preferred share holding paying him 10% and got warrants to buy $5 billion of stock at $115 a share. In 2011 Goldman Sachs redeemed the preferred shares to end the interest payment of 10%. Later the warrant deal was revised. Buffett agreed to exercise the warrants through a cashless transaction. He would receive an amount of stock equivalent to the paper profits he would have earned. This took place the last 10 days of September earning approximately $2 billion on the 13.2 million shares Buffett received. Earning $2 billion on this investment is incredible. Buffett knows how to take advantage of opportunities. Let’s see what kind of profit opportunities we can find in GS Stock.
Put Selling Goldman Sachs Stock – GS
Goldman Sachs is huge and definitely falls in the criteria of stocks that I consider for trading. There are though some problems with it which I will discuss in the article. Goldman Sachs Stock trades at a decent 9.6 times PE. Book value is $162.47 which means the stock is trading for less than book value. Cash flow is $19.17 a share. Annual Dividend is just $2.20 for a 1.39% return. Revenue to date is $41.6 billion which is below JP Morgan and Bank of America.
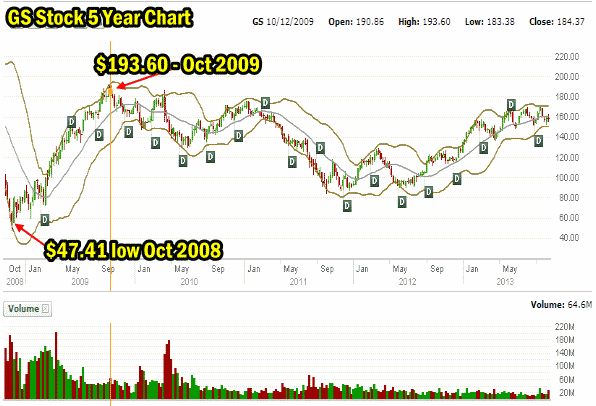
GS Stock – 5 Year Chart
The 5 year chart below shows that unlike the previous bank we looked at, BK Stock, GS Stock has had a wild ride over the past 5 years. This bank has never recovered the highs of October 2009. In fact GS Stock was trading as high as $236 in 2007 before the financial crisis. However the bottom looks like it may have come in 2012 and since then the stock has been climbing higher. If you look strictly at volume there was a huge amount of trading during the crisis when the stock plunged to $47.41 in Oct 2008. From there is ran back to $193.60 which for anyone who bought stock in late 2008 was literally a gold mine. What a return that would have been!
Since then volume dropped off until in May 2010 when it looked like the rally in stocks might end. When the Fed stepped back with into the financial markets with QE2 to stop any decline in the stock market, there was a tremendous amount of trading again which ranged from about $166 down to around $144. Following that period the stock slid falling back below $100 in late 2011 and into 2012. Volume picked up a little bit but it did not match the prior two big volume spikes. Since then volume has remained fairly average despite the stock climbing higher this year. Support in this stock though sits around the $100 level over the 5 year period and from there the next level is down to $80. The pattern of this stock over the last 5 years would make Put Selling difficult.
This year though with the rise in GS Stock Put Selling would have been somewhat easier.
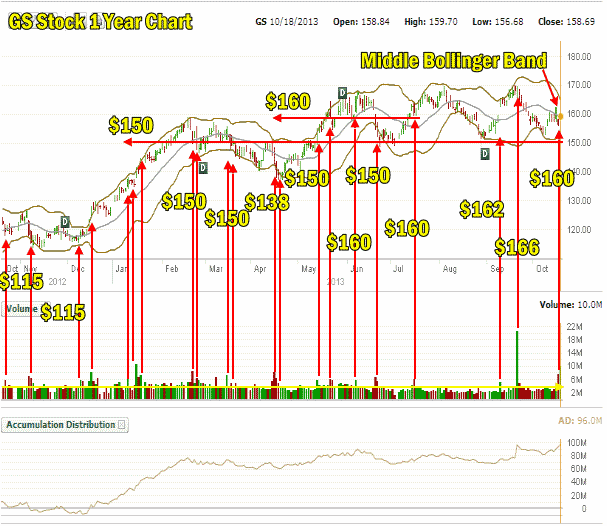
Put Selling Strikes GS Stock 1 Year Chart
My interest in GS Stock would be very short-term. I have no interest in owning the stock for any period of time. It does not have an ideal pattern but there are some strikes which if the put premiums were large enough I would be interested in considering them for Put Selling. The first is the $150 level. it has the most support this year. The $160 has very little support which means I would not consider it at all. The $150 put strike is best sold on dips. On Friday the $150 was as high as $1.53 but the price being that high was caused more by the stock having trouble with the Middle Bollinger Band. Buffett’s interview helped boost the stock but this stock is a lot harder to manipulate so the boost from the interview is already eroding.
There are many reasons I have stayed away from GS Stock. The stock can move a lot intraday which pushes up option premiums which is helpful, but it can also pull back dramatically which might break back down to the $150 level. Option volumes are good, but the increments are in $5.00 stretches which makes it far more difficult to apply rescue strategies against should the stock decide to revisit the next support level which is all the way down to around $120. To rescue naked puts in GS Stock quickly would require more capital to be applied and with a stock like GS Stock it would not need just a few thousand dollars but more. The question then becomes if I was to trade GS Stock to aim for perhaps 1% a month, is it worth the risk of assignment? There are dozens of stocks to choose from and my strategy is not the same as buying a stock and hoping it climbs. My strategy is to sell the puts, earn the put premium and never be assigned shares. If I can earn 1% on a stock like YUM, XOM, KO, PEP, INTC and many more, is it worth the risk of assignment just to sell puts on GS stock for 1%. My answer would be no.
Accumulation and distribution chart shows that the stock has been in accumulation mode since the start of the year and has remained steady which is a good sign.
Put Selling Strategy For GS Stock
I covered my outlook for Put Selling GS Stock above. I don’t see a great advantage to it when so many other stocks have better more stable patterns with less risk of assignment.
Other GS Stock and Option Strategies To Consider
The 6 month chart below though shows an interesting pattern which is tradable using the Bollinger Bands to a lesser extent and relying on MACD and the MACD histogram to give clear signals when to act. The green arrows indicate when to buy shares, buy calls or put credit spreads. The red arrows indicate signals to sell shares, sell calls and close put credit spreads. The key is to use MACD with fast points of 12, slow points at 26 and smoothing at 9 to try to pinpoint up signals and down signals. The MACD histogram is handy as it shows the direction the next signal may take. This is good for getting ready for the next trade whether it be to buy or sell. Using a stop-loss if purchasing GS Stock would be quite valuable but because the stock tends to move a lot during the day it also means being stopped out earlier than possibly desired. But as long as there is a profit, perhaps being stopped out early does not matter.
You can see that the latest UP signal may be in jeopardy at this point so like all signals, there will always be false signals. The stock though moves enough that even 300 shares can result in a very nice return as a movement of even $10, which is common with GS, would return $3000 each time.

Put Selling Buffett’s Bank Part 2 – GS Stock – Final Word
The final word on this Warren Buffett bank that it meets my criteria as a large cap stock but there are a lot of factors I do not like. Everything from too wide an option increment at $5.00 to wide daily swings makes this a difficult stock for Put Selling. Overall I believe there are safer stocks for Put Selling than GS Stock, but for trading stock as in the MACD outline above, GS Stock does make the grade.
Next up is Wells Faro Stock: WFC which is in the members section.
Disclaimer: There are risks involved in all investment strategies and investors can and do lose capital. Trade at your own risk. Stocks, options and investing are risky and can result in considerable losses. None of the strategies, stocks or information discussed and presented are financial or trading advice or recommendations. Everything presented and discussed are the author’s own trade ideas and opinions which the author may or may not enter into. The author assumes no liability for topics, ideas, errors, omissions, content and external links and trades done or not done. The author may or may not enter the trades mentioned. Some positions in mentioned stocks may already be held or are being adjusted.
Internal Stock and Option Trades Links
Put Selling Strategies For Members
Covered Calls Strategies For Members
Profit And Income Strategies Index
Stock and Option Strategies For Members
Stock And Option Trades Explained For Members