
Market timing is not a science but after using it for years I have found that often just one or two indicators tend to be the more accurate. This is the reason in my market timing tool chest I keep the MACD Histogram (Moving Average Convergence / Divergence), Ultimate Oscillator and both Slow and Fast Stochastic indicators to assist in predicting market direction.
Over the years I have found that my market timing indicators have been right on market direction more often than wrong.
These indicators are prime market timing and market direction tools that have given me warning in advance that a change in market direction may be in the works. I add to these tools the Rate of Change and Momentum, but I put more credit in MACD Histogram, Ultimate Oscillator and the Slow and Fast Stochastic indicators and then look to the other two market timing tools to confirm what these four indicators are saying.
Tonight is one such example. We all know the expression Sell In May and Go Away. Indeed the Trader’s Almanac has an excellent track record study showing that over a period of 6 decades this strategy has paid handsome returns to those investors who only invest from November to April. Indeed even in 2008, if an investor had left the market on April 30 2008 and not re-entered until Nov 1 he would have been spared a lot of grief. He would have had losses but surely most investors would have realized in April 2009 that they should stay in longer for the rally.
The Trader’s Almanac also points out that election years tend to be different for the market. As a market timing tool both may be lacking somewhat but there is some truth to both theories. Election years tend to see a weak April and early May and then the market takes off into the summer before slowing down. The stock markets then pick up in the fall as the nation goes to the polls.
But will this election year be a bit different? My market timing indicators for this evening are showing a market perhaps ready to experience a bigger pullback than most investors realize. A lot of this is just guessing on my part but I was surprised to see that the market timing stochastic indicators are both showing a market direction change. Indeed the slow stochastic flashed a market change on the NASDAQ on May 1.
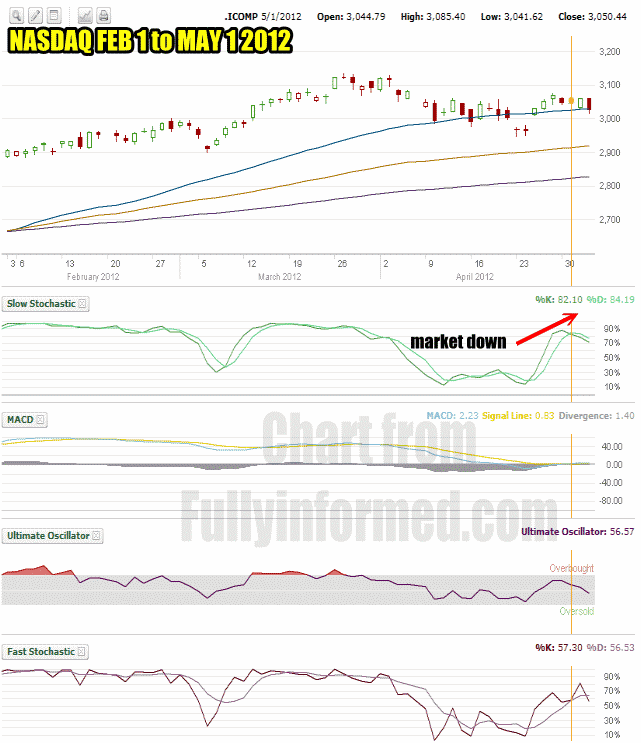
May 1 2012 the market timing slow stochastic flashed a market direction down call.
Today, May 3rd, the NASDAQ Stock Market has the market timing indicators of Slow Stochastic, Fast Stochastic and Ultimate Oscillator flashing warnings that the market is about to pullback.
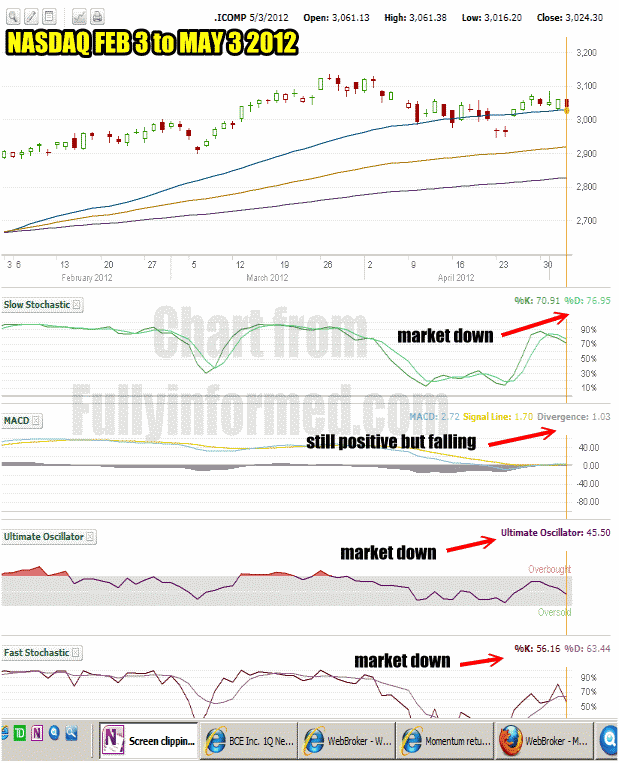
Today May 3 2012, the market timing tools on the NASDAQ indicated that the market direction is lower.
Missed Market Timing Slow Stochastic Yesterday
Yesterday I missed the S&P 500 slow stochastic indicator warning of a change in trend. Today though the fast stochastic is signalling market down and the slow stochastic is confirming it. The Ultimate Oscillator is barely positive as is rate of change and momentum but MACD Histogram which is a very important momentum indicator is still positive although it has fallen from yesterday’s reading.
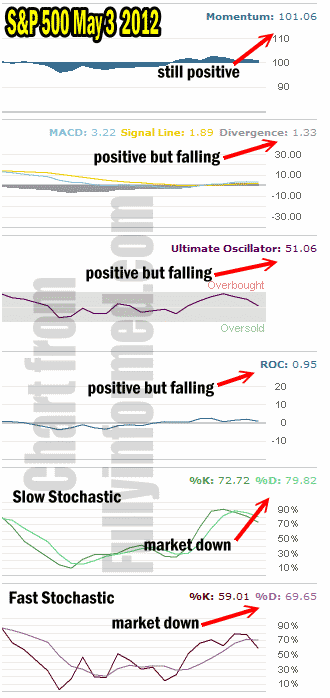
Stock Market Timing indicators for the S&P500 shows market direction is changing
Market Timing Also Includes New 52 Week Stock Highs
Another good market timing indicator is the number of new highs. While the market is meandering back and forth and stuck in a tight range many stocks are making new highs. You would think this is bullish and in theory it is, except when new highs are made in strong bull markets, the market itself is also experiencing new highs. This is not happening and often new highs in stocks not being confirmed by the overall stock market trend is a market timing warning worth watching.
So yesterday my market timing indicators showed market still up and today two important ones, the slow stochastic and fast stochastic are decidedly saying market down. To add credibility to their prediction is the NASDAQ stock market which as explained also shows market direction down.
Market Timing Summary – Be Careful
The worry now is which prediction is correct. As far as market timing indicators go I put a lot of value in MACD, Ultimate Oscillator, Slow Stochastic and Fast Stochastic. Two are decidedly negative on the S&P 500 and three are bearish for the NASDAQ. The NASDAQ has been a leader of this entire bull market since March 2009.
Weighing the prediction I believe is easy. The market direction might be about to change. I may soon see my SPY PUT back in action. It will be interesting to see what the market timing indicators say for tomorrow after the market closes.