As regular readers of FullyInformed know, the Weekly Initial Unemployment Insurance Claims has proven to be one of the best Market Timing System methods. It has a long proven track record. In particular this Market Timing System is quite good at advising when there is pressure building to the downside for a major correction. You can read the entire article on that market timing system method through this link.
Every Thursday I check the Weekly Initial Unemployment Insurance Claims. Today’s numbers show that Friday’s unemployment report should show more jobs being created.
The ADP National Employment report showed U.S. private employers added 176,000 jobs in August. This was slightly less than the average estimates of 180,000 jobs being created.
The weekly initial jobless claims fell more than expected to a seasonally adjusted 323,000. This figure is in line with the past few weeks and points to a good jobs number on Friday which could mean Fed scaling back of Quantitative Easing can commence as early as this month (Sept 2013).
The Weekly Initial Unemployment Insurance Claims is now running at 6 year lows. While this is excellent news it is still far from a strong recovery which normally sees many weeks of 250,000 Weekly Initial Unemployment Insurance Claims rather than continually staying above 300,000. In other words, the recovery is still underway and the labor market is stable. A new blog I just stumbled upon had an excellent article which pointed to stable employment and stable job growth. You can use this market timing system link to read the article on that blog.
Market Timing System Performing Well
According to this market timing system based on Weekly Initial Unemployment Insurance Claims today’s number of 323,000 suggests that the ongoing correction will not turn into a deeper correction. According to this market timing system, any selling pressure will produce shallow dips but until there is an increase in the Weekly Initial Unemployment Insurance Claims to above 350,000, the bias for stocks is still higher.
Market Timing System – Weekly Initial Unemployment Insurance Claims Chart
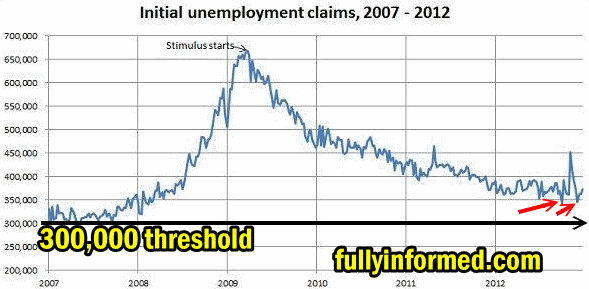
If we look at the Weekly Initial Unemployment Insurance Claims chart below you can see that we are still above 2007 levels before the credit crisis and recession got underway. You can also see that we are a long way down from the claims in 2009 when the numbers had risen above 650,000. The US economy however still needs numbers back below the 300,000 level to the 250,000 level to really get the economy humming again.

Market timing system based on the USA Initial Unemployment Insurance Claims
Using This Market Timing System
The system is simple to use. Numbers above 350,000 weekly are normally followed by weakness in the market direction move higher. Numbers higher than 375,000 have almost always seen sell-offs. Numbers above 390,000 are signals that buying puts on the market or purchasing Ultra Short ETFs warrant attention from investors. Today’s numbers should support higher prices for stocks in general and signal that dips in stocks should be bought or Put Selling done (which I am engaged in) as overall the market direction should move higher or certainly not collapse.
The Weekly Initial Unemployment Insurance Claims remains one of the better market timing systems which has withstood years of use. While nothing that is foolproof, it is surprising how accurate this market timing system has been at predicting the longer term trend in stocks. It cannot of course take into unforeseen events such as the present Syrian crisis but overall it is a good comfort measurement of when to be cautious and when to stay invested.
Internal Market Direction Links
Profiting From Understanding Market Direction (Articles Index)
Understanding Short-Term Signals
Market Direction Portfolio Ongoing Trades (Members only)

