

By now I am sure that most investors know I consider the Weekly Initial Unemployment Insurance Claims to be one of the best Market Timing System methods. The track record of this system is well proven. This Market Timing System often spots pressure building on spots and those who follow this market timing system often get a “heads up” before other investors. It can be especially useful in combination with using the Spy Put Options trades which I do regularly as well as the VIX Index Strategy.
Interested investor can read the entire article on this market timing system method through this link.
Feb 13 2014 Weekly Initial Unemployment Insurance Claims
The new Fed chairman, Janet Yellen commented earlier this week in her testimony that there is a degree of non-participation within unemployment in the United States. In other words, there are a lot of long-term unemployed who have not re-entered the jobs market. This has skewed the unemployment rate to some degree. In fact analysts believe the number of Americans who are non-participants (not gainfully seeking employment) is the highest it has been since perhaps the 1930’s. Most believe the non-participation rate is the highest in over 30 years, but possibly even longer. This shows how uneven the recovery has been and as an investor it is important that I understand this as it can easily mean the weekly initial unemployment insurance claims can often surprise to the upside. Those investors who follow this market timing system know that as the numbers within the weekly claims climb, pressure builds to the downside on stocks. The “magic” number is 350,000 for when stocks really start to have trouble, but even numbers like today’s show the headwinds that stocks are facing in recovery past highs and moving even higher.
Looking To The Charts
If we look at this chart of the Weekly Initial Unemployment Insurance Claims from the Labor Department you can see the signals to be on the watch for. 350,000 is sort of the “magic” number. When the Weekly Initial Unemployment Insurance Claims start to rise higher the market direction up has more trouble. It can stall, slow or even begin to pull back. Above 400,000 initial claims and stocks face serious headwinds.
I break the chart down by three terms. The first is muddling along which is where we are now economically. There is some growth, but not enough to truly see consumers buying robustly. The chance of inflation growth at this level is low. Below 325,000 weekly claims I label as hope. The hope is there will be more hiring and the weekly claims will fall as more people find jobs. Below 300,000 we can label as strong economic growth. Below 250,000 is inflationary pressure and better wages which means a much stronger economic outlook. We have not been below 300,000 more than a few times since the credit crisis. We have not been down to 250,000 in many years.
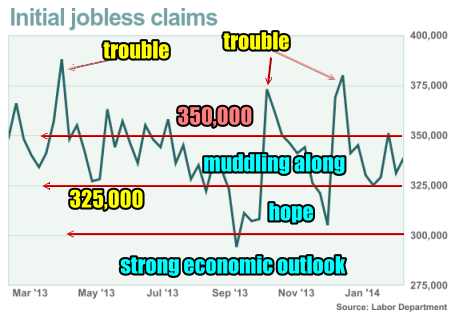
Today’s numbers rose by around 8,000 to place the Weekly Initial Unemployment Insurance Claims to Feb 8 (last week) to 339,000. So this places us right in the muddling along region. Stocks can still push up from here. Also any pullback is still an opportunity to add to positions and to trade, such as selling puts.
Trading Chart Based On Weekly Claims
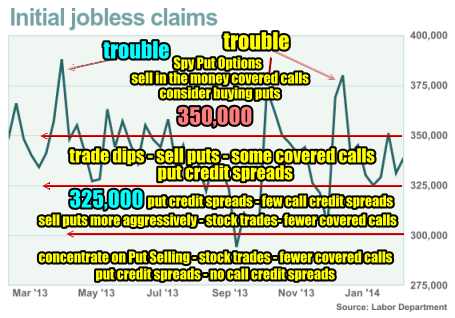
Years ago I developed the chart below based on using the Weekly Initial Unemployment Insurance Claims as a market timing system. It tells me at a glance which strategies to be focused on depending on the initial jobless numbers. Here is the basics behind the strategies:
Weekly Numbers Above 350,000 and Climbing
I focus more on selling in the money covered calls and doing Spy Put Options aggressively. As the weekly claims rise and get closer to 400,000 I normally buy puts on stocks that based on chart patterns I believe are overvalued and will pull back if the market direction corrects. I tend to place fewer trades and begin to raise cash. Above 400,000 I raise a lot more cash.
Weekly Numbers Between 325,000 to 350,000
When the weekly numbers move below 350,000 but stay above 325,000, such as the period now, I focus on trading dips in stocks through selling puts usually naked, doing some put credit spreads and doing some covered calls. This is because in this range normally the market can still move higher but it is more difficult for it to be a straight line up. This means I can sell some covered calls when the market is pushing higher because the likelihood of it not pushing too high is much greater. This will leave my covered calls normally out of the money and expired. I also pick up some stocks for short-trades often referred to as swing trades or even day trades although I do not do many day trades. I only pick up stocks in dips whether they are in a dip themselves such as Cisco this morning, or the market in general is dipping such as it did last week, which pressures almost all stocks. This is a good place for put credit spreads as well since it offers more protection than selling puts naked. This is also not too bad an area for call credit spreads as stocks may have a more difficult time rising too quickly or high enough to place call credit spreads at risk. I tend though not to do a lot of call credit spreads. I prefer being on the Put Selling side.
Weekly Numbers Between 300,000 to 325,000
When the numbers fall below 325,000 stocks have a much easier time moving higher. This means being careful with covered calls unless I do not want to own the stock and would like to be exercised out. It also means being careful on call credit spreads which I do rarely anyway. I sell puts far more aggressively here and will definitely consider put credit spreads as well.
Weekly Numbers Below 300,000
Below 300,000 the market direction rarely corrects. This means I concentrate heavily on Put Selling, doing stock trades particularly using the Bollinger Bands Strategy Trade.
I do very few covered calls, although in my retirement account I do a lot of covered calls on stocks I want exercised. This is because in Canada investors are not allowed to sell puts, even cash secured puts, in our retirement accounts. Therefore I look to set up covered calls trades wherever practical to earn profits that can compare to Put Selling trades. This is not always as easy as it might appear. Put Selling is far superior to covered calls in my opinion. You can read this article to understand why.
At the level below 300,000 I increase the quantities of naked puts I sell and as the numbers fall to 250,000 or more I bring more cash into play. I do no call credit spreads but the number of naked puts is easily 4 or more times higher. When the Weekly Initial Unemployment Insurance Claims get to this level the economy is usually booming and stocks are doing well.
Weekly Initial Unemployment Insurance Claims Market Timing System Summary
For this latest update then we are back to any correction being a trading opportunity as the market stays in the Muddling Along territory. The move closer to 340,000 though is a definite signal to be aware of. If next week’s numbers get above 340,000 look for the market direction higher to definitely stall out. Investors are nervous as it is. The retail numbers were not great today and while much of it can be blamed on cold and snowy weather, they are still bad numbers. Those numbers will be reflected in revenue growth in many companies from Wal-Mart and Best Buy to McDonalds, Yum and many clothing retailers.
Blame Game
Overall analysts can blame whatever they want for bad and good numbers, but overall the numbers give investors signals to be aware of and right now the numbers are showing lackluster employment which for two months has been the case in the weekly non-farm payroll numbers. The numbers are also telling us that retail is poor and that means consumers are not out spending. 70% of the entire economy depends on retail consumers so these figures are not to be ignored.
Outlook Is “Keep Watch”
The numbers do not point to any significant collapse of stocks but instead advise investors to watch for any move higher for Weekly Initial Unemployment Insurance Claims. A cautionary stance remains warranted on stocks based on the Weekly Initial Unemployment Insurance Claims rising to 339,000. However for my market timing system there is no reason not to continue to be Put Selling on dips and considering put credit spreads as well as a handful of stock trades which is exactly what I am continuing to do.
Internal Market Direction Links
Profiting From Understanding Market Direction (Articles Index)
Understanding Short-Term Signals
Market Direction Portfolio Ongoing Trades (Members only)