
Market Timing / Market Direction will be my new heading for my outlook on the stock markets and where they are heading in general. I moved to this heading because I want to touch on a wider variety of materials as I want to touch upon various market timing systems that are being used or have been used for decades when looking at overall market direction. I want to keep market direction in my headings because it is the overall market direction that I watch to determine the market timing of selling puts and covered calls.
Why Market Timing and Market Direction?
Without having some idea about what market direction I think markets are heading, I cannot have confidence in my choices of when to sell options and at what strikes. Market timing is important because the ability of timing the markets is something that has frustrated investors for decades and yet it is still important to most investors as they remain concerned about market timing for trade entry and exit points.
A case in point is my friend Patrick over at www.mtrig.com (shameless plug). On his site he has developed a market timing model which is quite good and he continues to adjust it and re-work it trying to get it better. Recently though, one of things that warned me that we were entering a bear market is the various market timing readings. Almost all the market timing systems I am aware of are being whipsawed from market up to market down and up to down again and again. Patrick’s market timing system has also experienced this issue. Those investors who trade with market timing systems are very frustrated. I have a number of investor friends who lost capital through the whipsaws and after September went to cash while waiting for clear market direction indications.
This Market Timing Indicator Is Bullish
Now that I have explained the changes I want to touch upon the High Low Logic Index devised by Norman Fosback in the early 1970’s. This market timing system is based on looking at the new 52 week highs and new 52 week lows as a percentage of the total issues traded, hence the name High Low Logic Index.
This simple market timing system points to a bearish trend when the readings are high. The interesting thing about this market timing system is that it is not based on their being more highs than lows or more lows than high. It is based on low readings of the High Low Logic Index. For example if there were many new highs and few new lows the reading would be low which is bullish for stocks. In the same way, many new lows and few new highs would also present a low reading which again is bullish.
If though there are few new highs and few new lows or many new highs and many new lows than that it bearish. To accomplish this Fosback used a 10 week exponential moving average of the indicator. Ned Davis Research every weekend runs the High Low Logic Index and looks at the value. This market timing system is at 1.7% which means the market direction is up.
According to Ned Davis Research, this market timing system has been this bullish only 4 times over the last 25 years and was correct all 4 times. The latest time was late fall 2008. Meanwhile the market timing index was not bearish earlier this year which Ned Davis explains means this is not a bear market.
Market Direction Outlook for Friday’s Options Expiration
So while the High Low Logic Index says no bear market, October options expiration has been negative 7 of the last 9 years according to my last 9 years of having options expire in October.
So will tomorrow’s options expiry be a down day in the market? Personally I think so. While today’s market recovery shows the bulls still are hanging on the chart does not look bullish. On the other hand many investors would say that after a rally from Oct 4, the market is just consolidating before breaking through resistance. Normally I might agree but looking at the chart below when the market direction turned on Oct 4 and broke the August lows, normally the market will return to test that lower low.
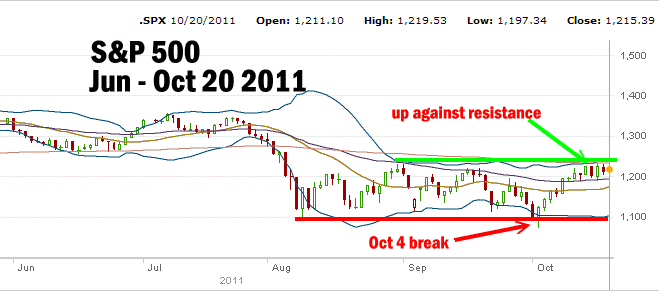
Market Timing / Market Direction June 20 to Oct 20 2011 S&P 500 Chart
However here is the chart that concerns me the most. The VIX chart for the rally from Oct 4 is showing that the volatility is heading higher since Monday of this week when the rally seemed to fizzle out. In almost every instance the rise in the VIX is followed by a market pullback. Select this market timing link to see a chart of the incredible rise in the VIX over the past trading sessions.
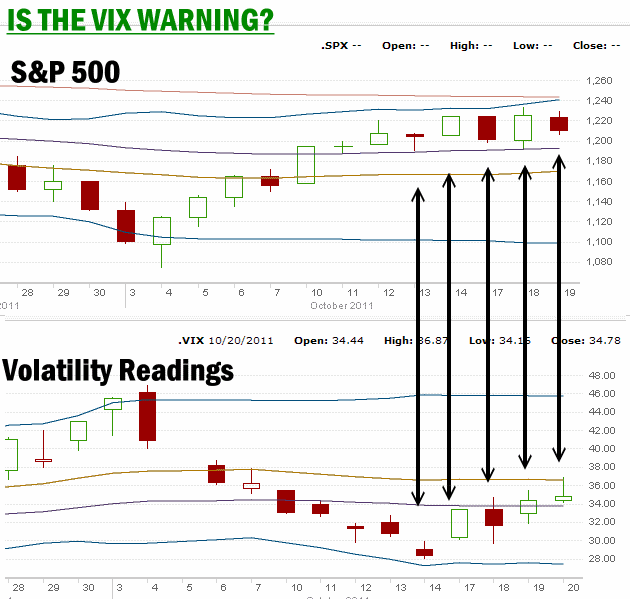
VIX Chart shows that volatility is increasing daily.
Friday Oct 21 2011 Is Also The End Of The World
Finally there is also this to contend with. Friday Oct 21 2011 is also the end of the world according to Harold Camping and his followers. But then perhaps he missed this in his Bible.

So while the market timing indicator High Low Logic Index says market up, I believe the market direction is down to at least retest the Oct 4 break sometime in the next week or two.