
FullyInformed.com
Generic filters

Market Timing / Market Direction Fed Kills Santa?

Dec 13, 2011 | Stock Market Outlook

Market Timing indicators yesterday indicated a sell confirmation. The markets today tried to climb, although the NASDAQ for most of the day was in the red. It was obvious, I would think to most investors that the little rally in the markets during the day was anticipation of the Fed meeting. These Fed meetings continue to disappoint investors who believe the Fed is going to introduce some wide-spread measures to throw more money at the problems and get stocks back rising.

Personally I think the Fed probably killed any hope of a major Santa rally to end out the year.

All the talk about QE3 and I suppose eventually it may happen. However the United States is not Japan and the Fed already has a couple of trillion dollars on its balance sheet, so I think right now with the economy grinding along, they prefer a wait and see approach. I have no idea what the Fed has up its sleeve for the next downturn in the economy but whatever the case my market timing indicators said market direction down and indeed it was an easy selloff once the Fed meeting indicated no special stimulus yet.

My SPY PUT trade for today was simple. Yesterday’s close showed market direction as down. This morning the market opened higher but my market timing indicators refused to budge even as the market climbed. I therefore bought my puts and waited until later in the day to sell them. It was an easy trade but again, I have confidence when my market timing indicators confirm market down making it easy to put in place my spy put trade.

Yesterday’s market timing indicators showed the weakness in the market. Today’s are even worse.

Market Timing / Market Direction Chart For Dec 13 2011

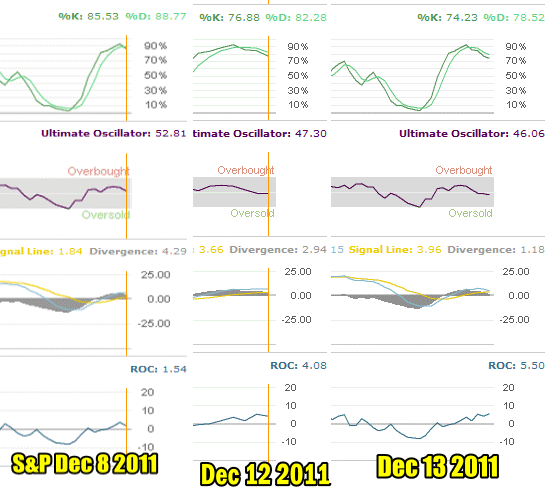
Here are the most important 3 trading session market timing readings. Dec 8, Dec 12 and Dec 13. They show that the market technicals are rapidly deteriorating.

Market Timing Slow Stochastic (top indicator) The top indicator shows a market that is losing any chance of a recovery.

Market Timing Indicator Ultimate Oscillator (second from top) continues to fall and is nowhere near over sold so there is plenty of room for the market to fall lower.

Market Timing Indicator MACD (Moving Average Convergence / Divergence) is on the verge of going negative with a reading of 1.18 which is a large fall from even yesterday’s trading session. MACD is warning that the market will definitely fall lower before it can move sideways. Use this market timing link to learn more about MACD.

Market Timing Indicator Rate Of Change (bottom indicator) is now rapidly rising with a reading of 5.50 showing that the selling pressure and momentum is growing, which will push the market lower.
Market Timing / Market Direction for Dec 13 2011

Market Timing / Market Direction for Dec 13 2011. When comparing the last 3 most important trading sessions, you can see the rapidly deteriorating situation.

Market Timing / Market Direction All Point Lower

Today’s market timing technicals all point for the market to move lower still. I believe MACD and Rate Of Change are indicating that the 1200 on the S&P will have little support and the market will easily drop below 1200.

Candlestick Is Bearish

For those who love candlesticks, today’s candlestick was a black candlestick which signifies selling pressure.
 

Next Stop November Lows

I believe that the next stop for the market will probably be the November lows which I discussed yesterday. I see no need to rush into put selling at this stage but to wait a few more days or at least certainly past Friday’s options expiry.  At that point the market will need to be assessed to see if there is enough strength for the market to grind sideways perhaps into the end of the year. The market timing indicators all point to continued bearish pressure on the markets and that means market direction remains down.

Recent Outlooks

Stock Market Outlook For Fri Aug 14 2026 – Bullish – New Highs

Prior Trading Day Summary On Thu Aug 13 2026 the July PPI numbers came in more “tame” than many analysts were predicting. Stocks moved higher as a result. The SPX ended the day up 50 points to close at 7798, …

Morning Investing Strategy Notes for Thu Aug 13 2026

For FullyInformed Members the morning Investing Strategy Notes for Thu Aug 13 2026 review the market action on Wednesday. There are a number of equity trades today. Stocks include ARM Stock (ARM), Cisco Stock (CSCO), Tapestry Inc Stock (TPR), Applied …

Stock Market Outlook For Thu Aug 13 2026 – Mixed Outlook For Second Day Ahead Of PPI Numbers

Prior Trading Day Summary On Wed Aug 12 2026 the July CPI numbers came in as estimated but did not show inflation is taking off. Stocks tried to rally off the news but with the latest PPI numbers due of …

Morning Investing Strategy Notes for Wed Aug 12 2026

For FullyInformed Members the morning Investing Strategy Notes for Wed Aug 12 2026 review the outlook for Wed Aug 12 2026 with the release of the July CPI numbers. There are a number of equity trades today. Stocks include Coreweave …

Stock Market Outlook For Wed Aug 12 2026 – Mixed Outlook Ahead Of Latest CPI Numbers

Prior Trading Day Summary On Tue Aug 11 2026 stocks continued to see light selling pressure as investors wait for more information on the Strait of Hormuz reopening and the latest CPI numbers today before the open. The SPX ended …

Morning Investing Strategy Notes for Tue Aug 11 2026

For FullyInformed Members the morning Investing Strategy Notes for Tue Aug 11 2026 review the outlook for Tue Aug 11 2026, one day ahead of the latest CPI numbers which are due out Wed Aug 12 2026 before the start …

Stock Market Outlook For Tue Aug 11 2026 – Still Bullish Ahead Of Wednesday’s CPI Numbers

Prior Trading Day Summary On Mon Aug 10 2026 stocks had a seesaw day as investors weighed the continued drama over the Strait of Hormuz and prepared for the CPI numbers due out Wednesday at 8:30. These will give the …

Morning Investing Strategy Notes for Mon Aug 10 2026

For FullyInformed Members the morning Investing Strategy Notes for Mon Aug 10 2026 review the outlook for the start of the second week of August. There are a number of equity trades today. Stocks include Goldman Sachs Stock (GS), Berkshire …

Stock Market Outlook For Mon Aug 10 2026 – Choppy Bias Higher

Prior Trading Day Summary On Fri Aug 6 2026 the initial reaction from investors on the surprising loss of jobs as reported by the July Non-Farm Payroll Numbers report was negative but by 10:15 stocks had already seen the day’s …

Morning Investing Strategy Notes for Fri Aug 7 2026

For FullyInformed Members the morning Investing Strategy Notes for Fri Aug 7 2026 look at the July Non-Farm Payroll Numbers and their possible affect on trading today. There are a number of equity trades today. Stocks include AIRBNB Stock (ABNB), …

Stock Market Outlook For Fri Aug 7 2026 – All About The July Jobs Numbers

Prior Trading Day Summary On Thu Aug 6 2026 stocks continued to stay bullish but not advance as investors waited for the July Non-Farm Payroll Numbers due out today at 8:30. The SPX fell 13 points to close at 7709 …

Morning Investing Strategy Notes for Thu Aug 6 2026

For FullyInformed Members the morning Investing Strategy Notes for Thu Aug 6 2026 discuss the state of the rally after stocks took a breather on Wednesday. There are a large number of equity trades today. Stocks include Expedia Stock (EXPE), …

Stock Market Outlook For Thu Aug 6 2026 – Overbought – Dips Likely – Flat to Higher Close

Prior Trading Day Summary On Tue Aug 4 2026 the rally took a breather but the Dow Jones and NASDAQ both made interim new all-time highs. The S&P was 7 points intraday from reaching 7800. The SPX slipped 13 points …

Morning Investing Strategy Notes for Wed Aug 5 2026

For FullyInformed Members the morning Investing Strategy Notes for Wed Aug 5 2026 review the two-day rally and the cautionary signals being generated. There are a large number of equity trades today. Stocks include Advanced Micro Devices Stock (AMD), Uber …

Subscribe For The Latest News